info
Best Scientific Image Contest 2022
For our Best Scientific Image 2022 call we received again more than 100 images that showcase the outstanding expertise in imaging in the Helmholtz Association. Discover the best 22 images of 2022 in this virtual gallery!
Gallery
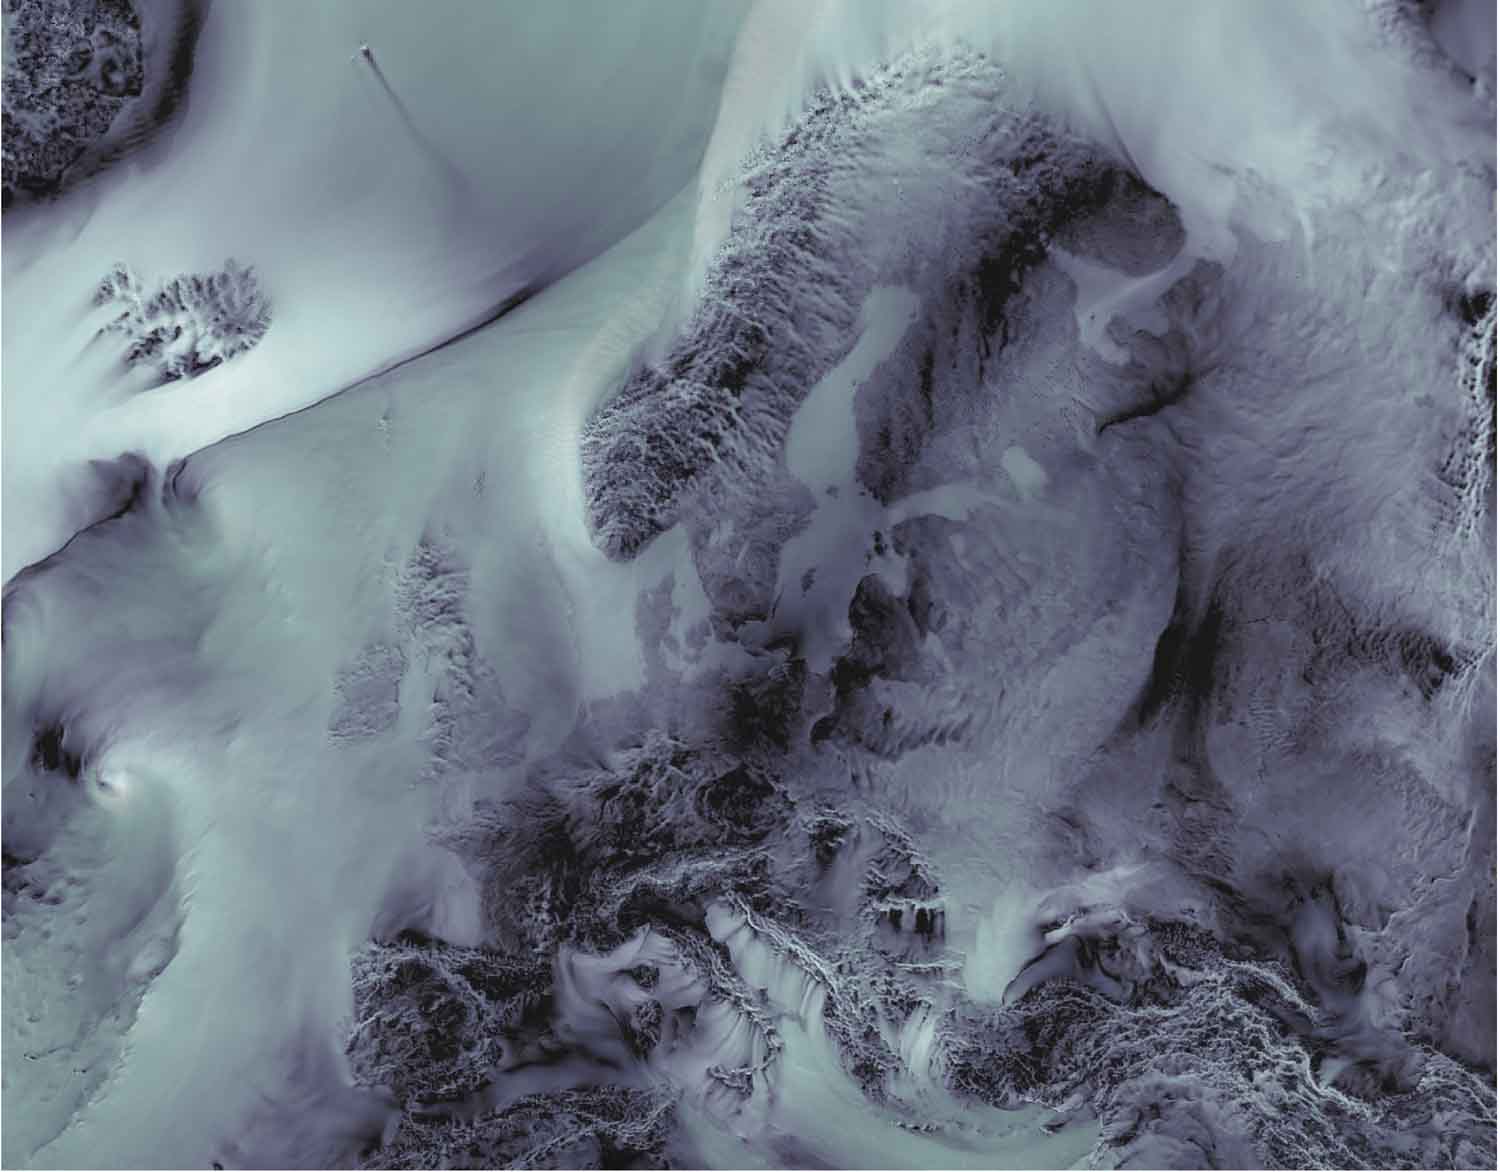

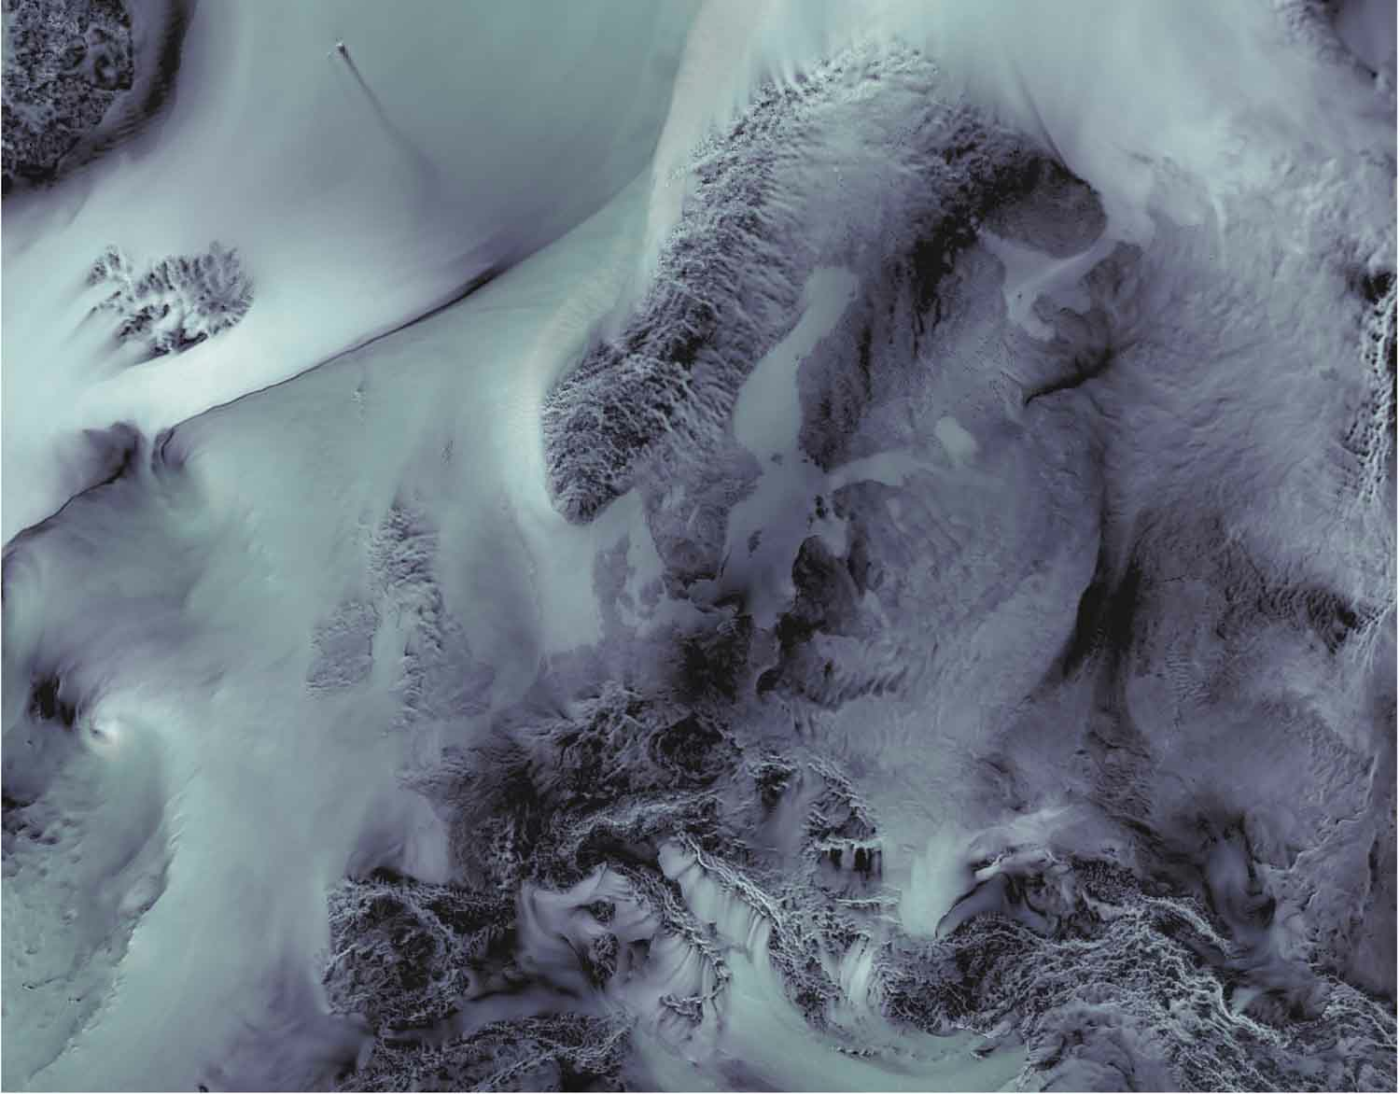
Europe in winds (1st Place, Jury Award)
Nikolay Koldunov, AWI
The Image shows wind gusts over Europe as simulated by a next-generation climate model with 4 km spatial resolution in the atmosphere. Those simulations, performed on world's largest supercomputers in the context of the EU Horizon2020 project NextGEMS, are part of the efforts to create Digital Twins of the Earth, including coupled atmosphere ocean models with very high spatial resolution, that will allow breakthroughs in our understanding of the functioning of the climate system along with its changes in a warming world – in support of evidence-based decision-making. This figure shows results of the model run that uses twice the resolution typically used for weather prediction and runs for a longer time (several months). Wind gusts are overlaid by the x-component of the wind for shading, which is plotted in gray-scale and made transparent. There is no explicit plotting of land, the high resolution allows for the land to “shine through” due to larger surface friction and hence smaller wind speeds. The darker the area the smaller the wind is.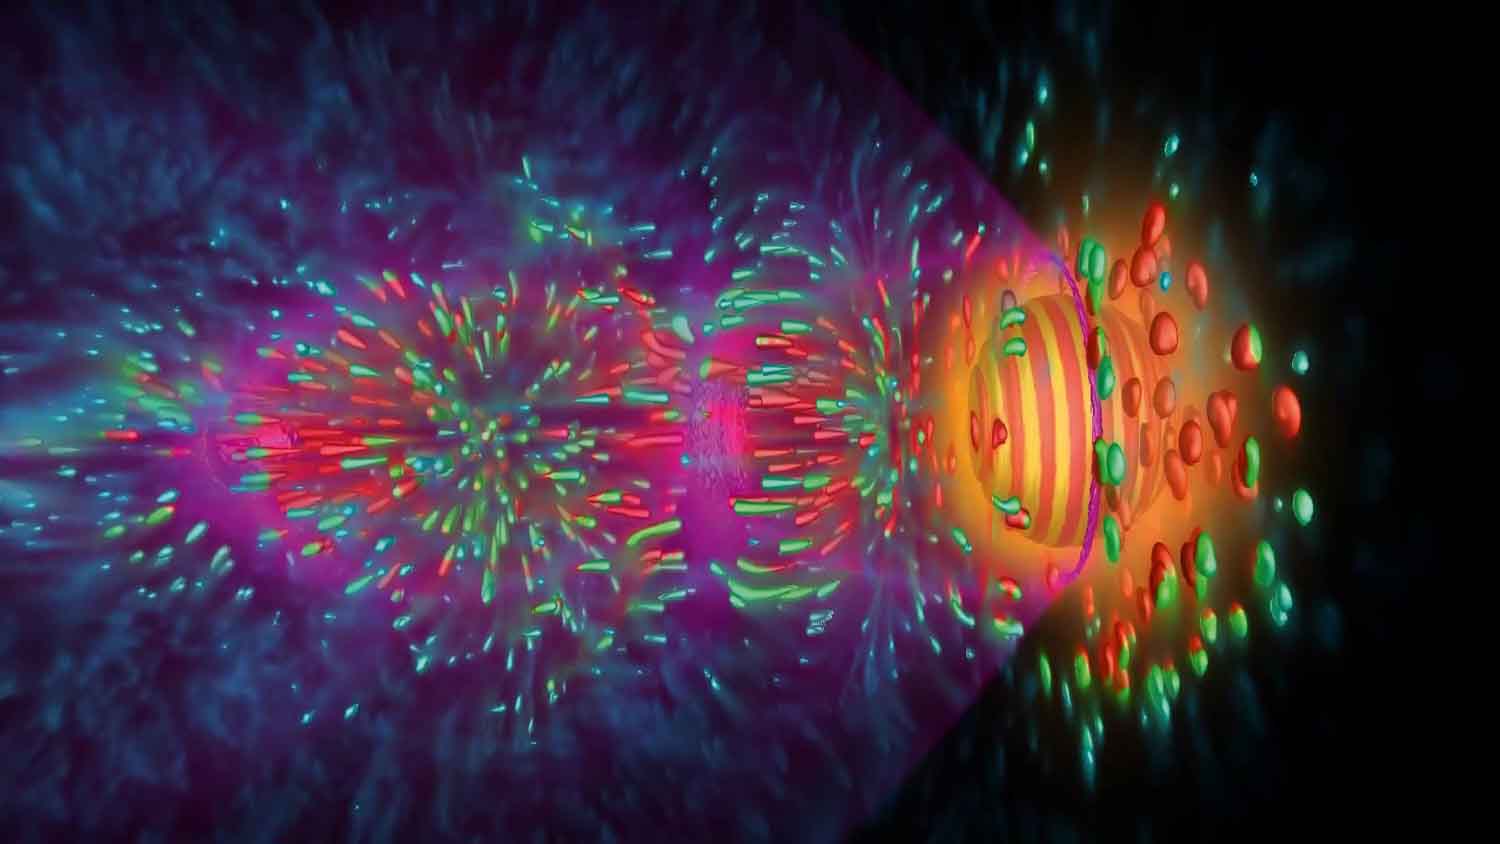

Laser Wakefield Accelerator for Electrons (2nd Place, Jury Award)
Michael Bussmann, HZDR
This image depicts a laser wakefield accelerator for electrons. This technology allows to shrink accelerators from km size to a few cm size, producing beams of unique quality. These unique beams are potential drivers of highly compact X-Ray and gamma ray light sources. These compact light sources are envisioned to complement existing large scale light sources and to democratize access to such sources due to their reduced cost and space requirements compared to conventional light sources. Experiments conducted at HZDR routinely produce ultrashort, nanocoulomb class electron bunches of several hundred Megaelectronvolt energy. Simulations of these special accelerators require exascale compute capabilities. They produce several hundred Terabyte per second of data, at twenty time steps and more per second. On the largest supercomputers in the world this speed up for the first time allows to produce real time interactive movies of these simulations using strongly-coupled in-situ visualization.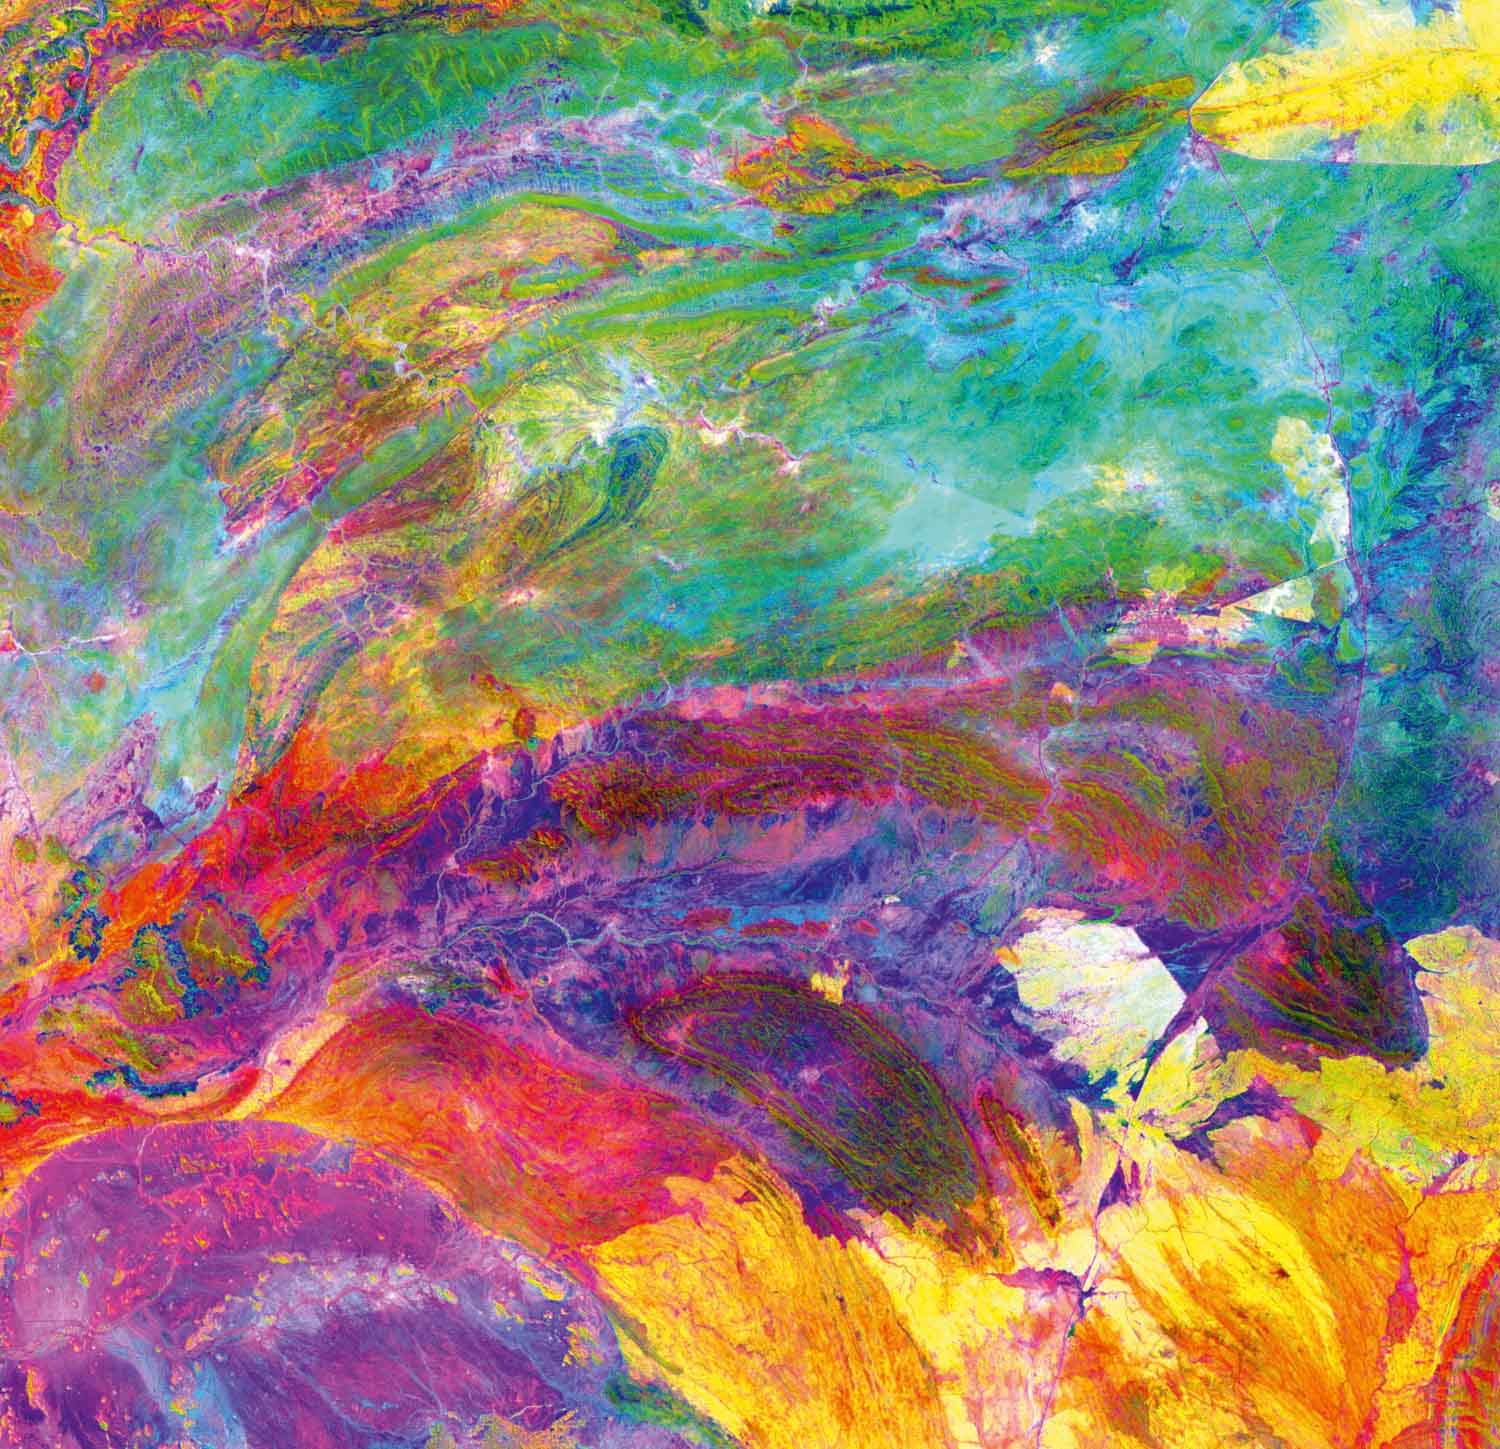

Finding rare earths from space (3rd Place, Jury Award)
René Booysen, HZDR
Green technology, which lays the foundation for the energy transition, requires the sourcing of critical raw materials. In order to find relevant materials, such as Rare Earth Elements (REEs), we need to know where to start looking. Satellite sensors can detect tiny changes in the infrared light not visible to the human eye. This characteristic spectral information can be used to identify rock types over a large area and to target potential resource occurrences. The presented image was acquired by the ASTER-satellite over a 3600 km2 area in northern Namibia. The mesmerizing colors are not the work of photo editing tools, but the result of a principal component analysis (PCA) applied to distinguish the different geological units. Here, the 1st three PCA bands are displayed in a false color composite. The small tear-drop shape structure in the upper half of the image reveals a carbonate-rich rock complex associated with REEs. With the help of satellite data, we can map the rocks and the tectonic deformations that are typically associated with rare earths.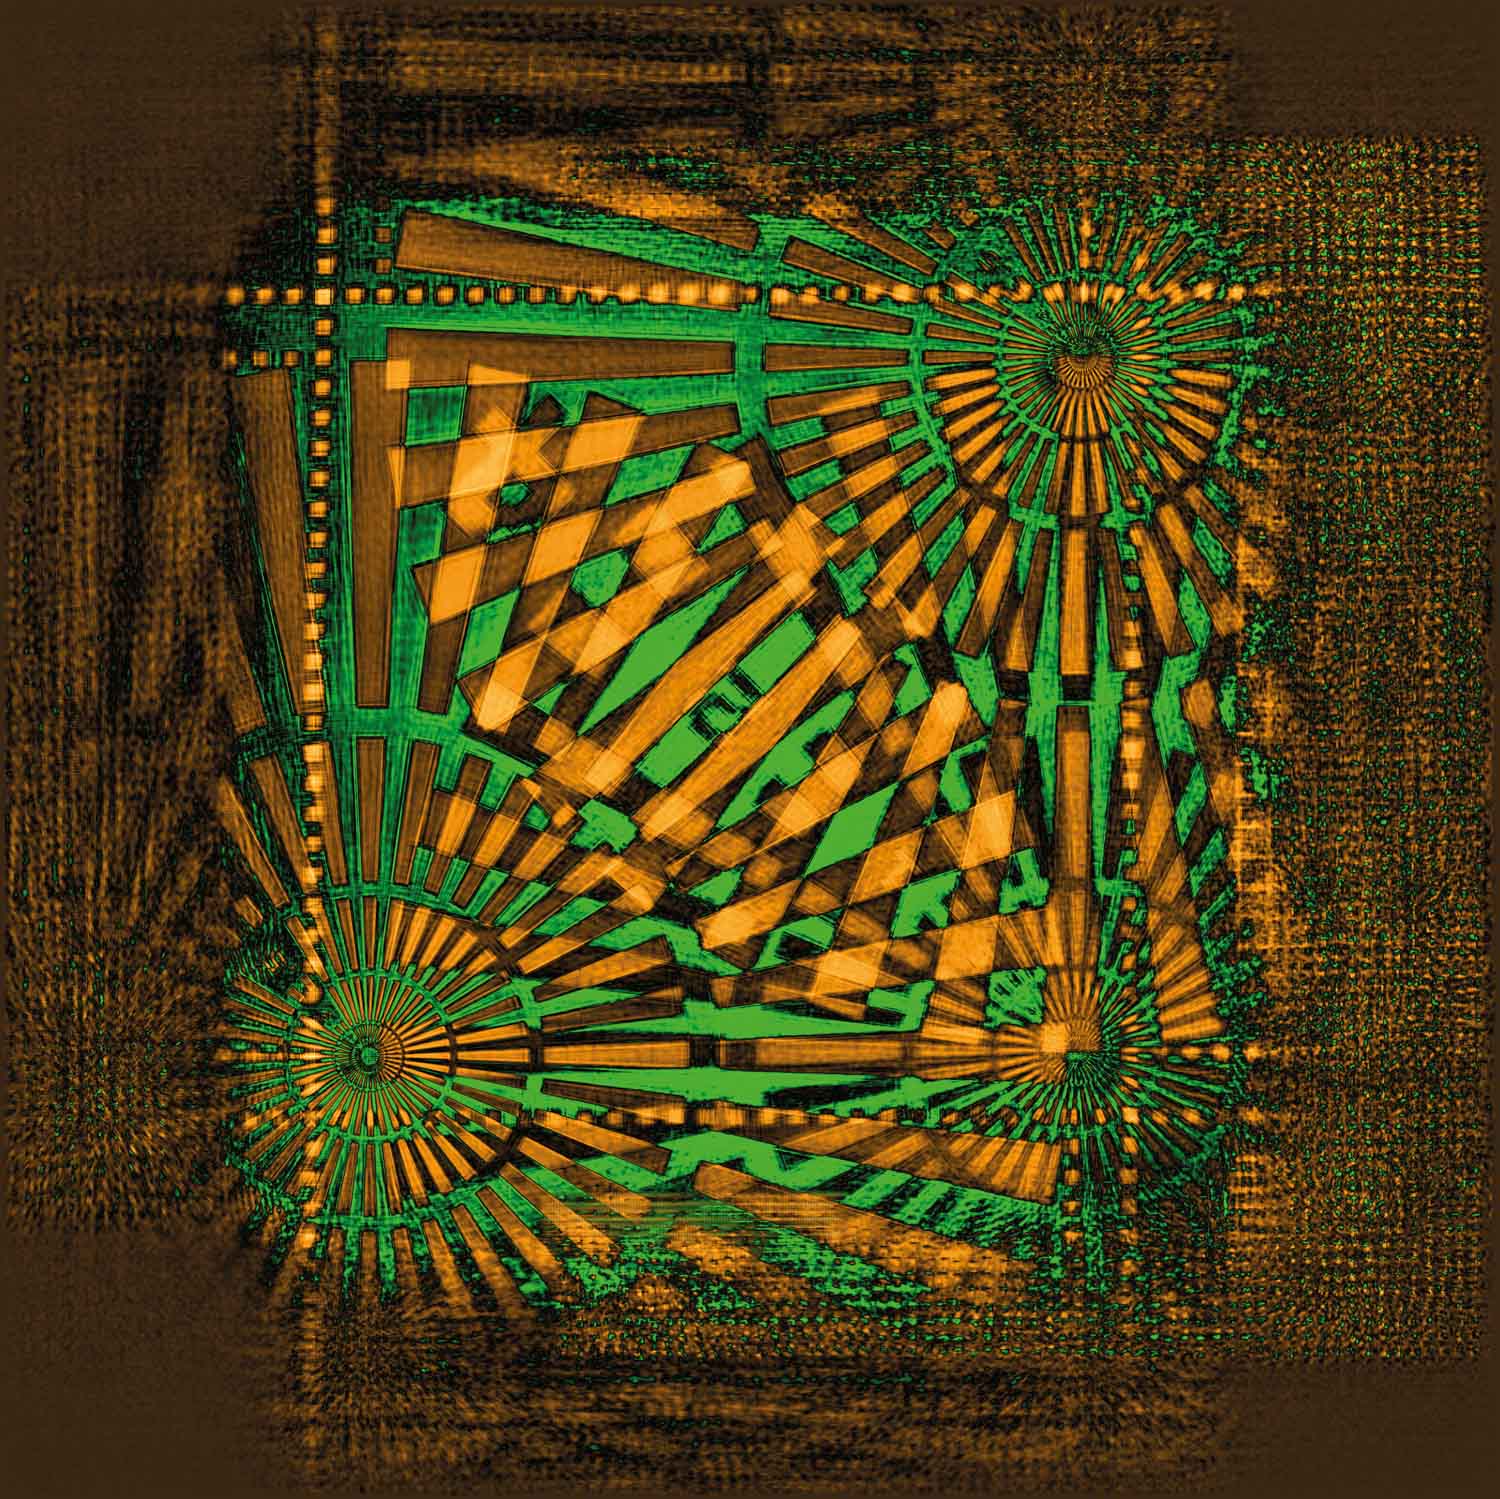

One star in three beams (1st Place, Participants' Choice Award)
Martin Seyrich, DESY
This image was taken using Multi-beam X-ray Ptychography at the beamline P06 at the PETRA III light source at DESY. Ptychography is a modern imaging techniques that permits to reach high spatial resolution and sensitivity in X-ray microscopy. Multi-beam ptychography is a new variant of the technique we developed at DESY which uses several beams in parallel to accelerate the measurement of large areas. This new variant needs an adapted evaluation algorithm to distinguish the contributions from the parallel beams. In this image, I have treated a data set obtained from three parallel beams with the conventional algorithm intended for only one beam. The result is an artful superposition of different regions of the sample as they are seen by the three beams. In our publication, we describe how to treat the data to obtain the corrected result: https://doi.org/10.1063/5.0045571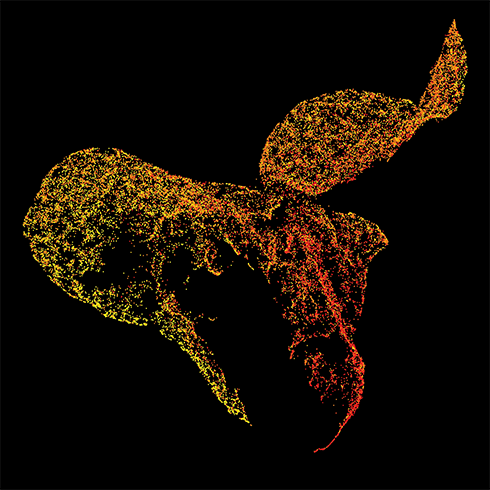

Latent phoenix (2nd Place, Participants' Choice Award)
Salome Kazeminia, HMGU
The latent phoenix depicts a low-dimensional visualization of red blood cell images encoded by a deep classifier. Each point represents one cell image, colored according to the different categories of sample classes (i. e., orange color for healthy cells and other colors for various anemia disorders). This visualization shows that our multiple-instance learning classifier can encode images from the same category close to each other with a smooth transition to different classes. By chance, the distribution of data points resembles a phoenix. Thanks to this embedding, we estimated the distribution of healthy cells and detected malignant cells, which improved the classification performance and explainability of our AI method.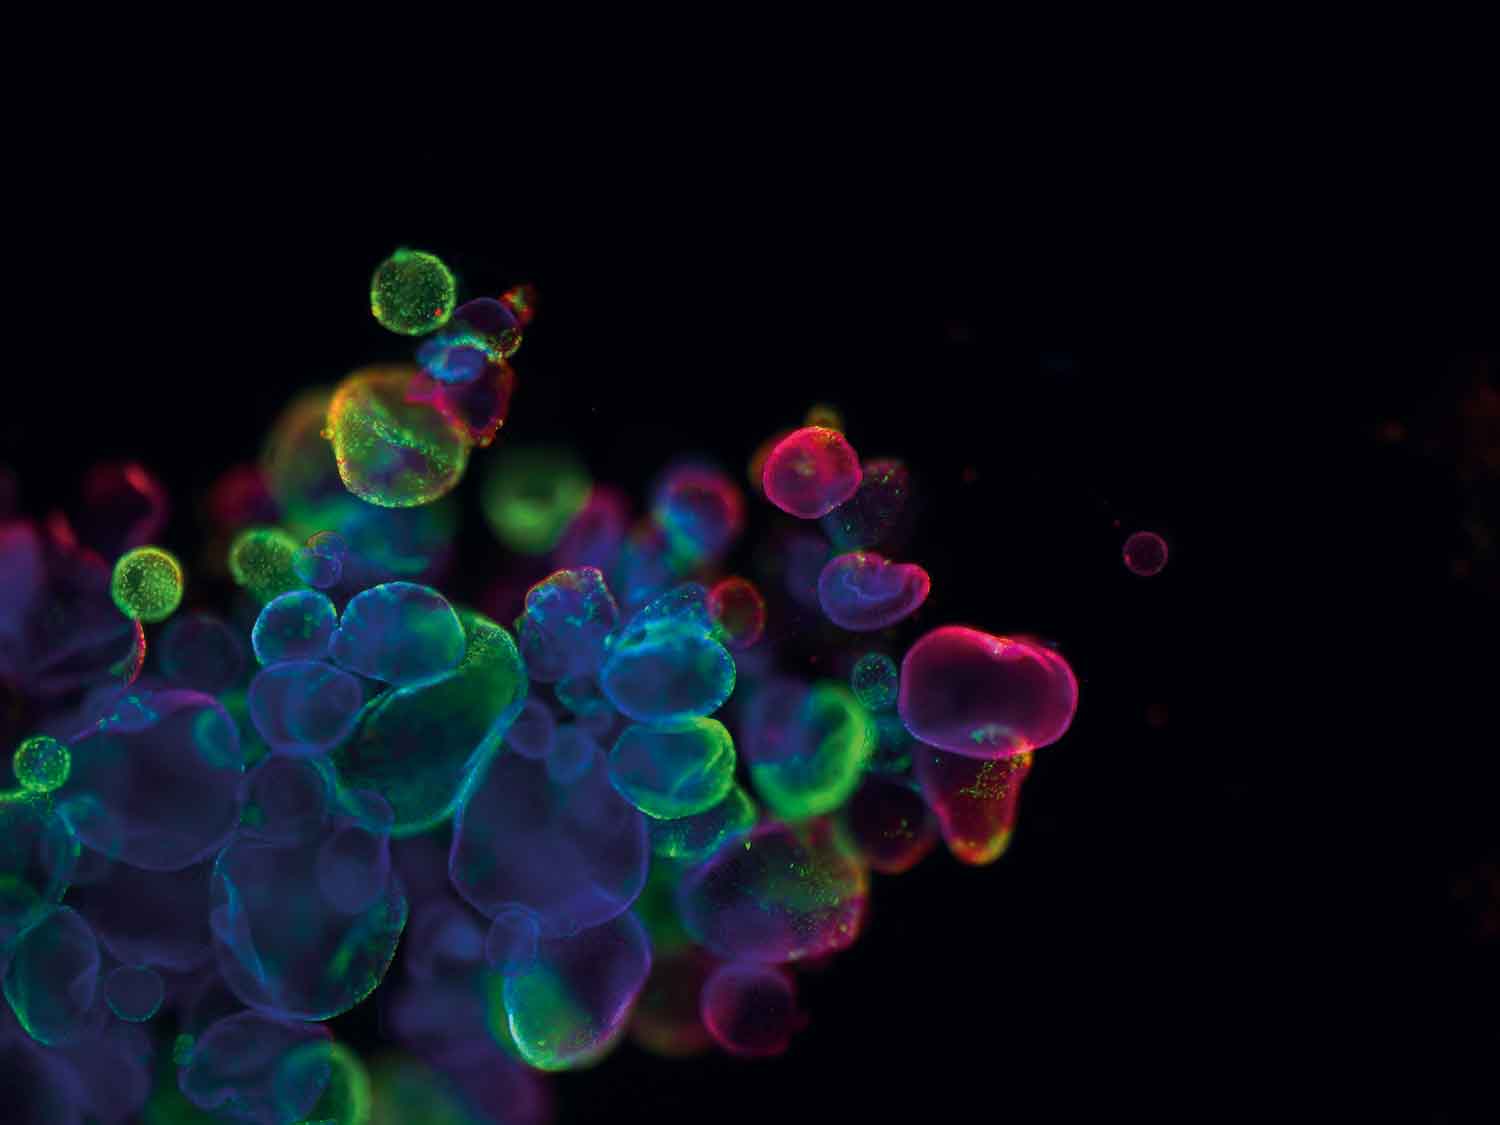

Placenta droplets (3rd Place, Participants' Choice Award)
Violeta Stojanovska, UFZ
The placenta is a newly formed organ during pregnancy, that arises from the fetal blastocyst by attaching to the maternal uterine lining. Mimicking the human placenta in an in vitro system can provide the unique opportunity to study how certain disorders and drug therapies can modulate the placental morphology and function thus affecting the maternal and the fetal health. Here we present a 3D model of placenta organoids, where specific markers were detected with immunofluorescence and subsequently visualized via fluorescent microscopy. Surprisingly, we detected two types of organoids from maternal and fetal origin. In red are presented the cytokeratin 7 positive organoids that show fetal origin (e. g. trophoblast derived) and, in green are observed the vimentin positive organoids that show maternal origin (endometrial stroma derived). The nuclei are presented in blue (Hoechst stain). Here for the first time we show that these separate organoids tend to cluster and get into a close contact. In turn, this should elicit the formation of the invasive part of the placenta, the extra villous trophoblast.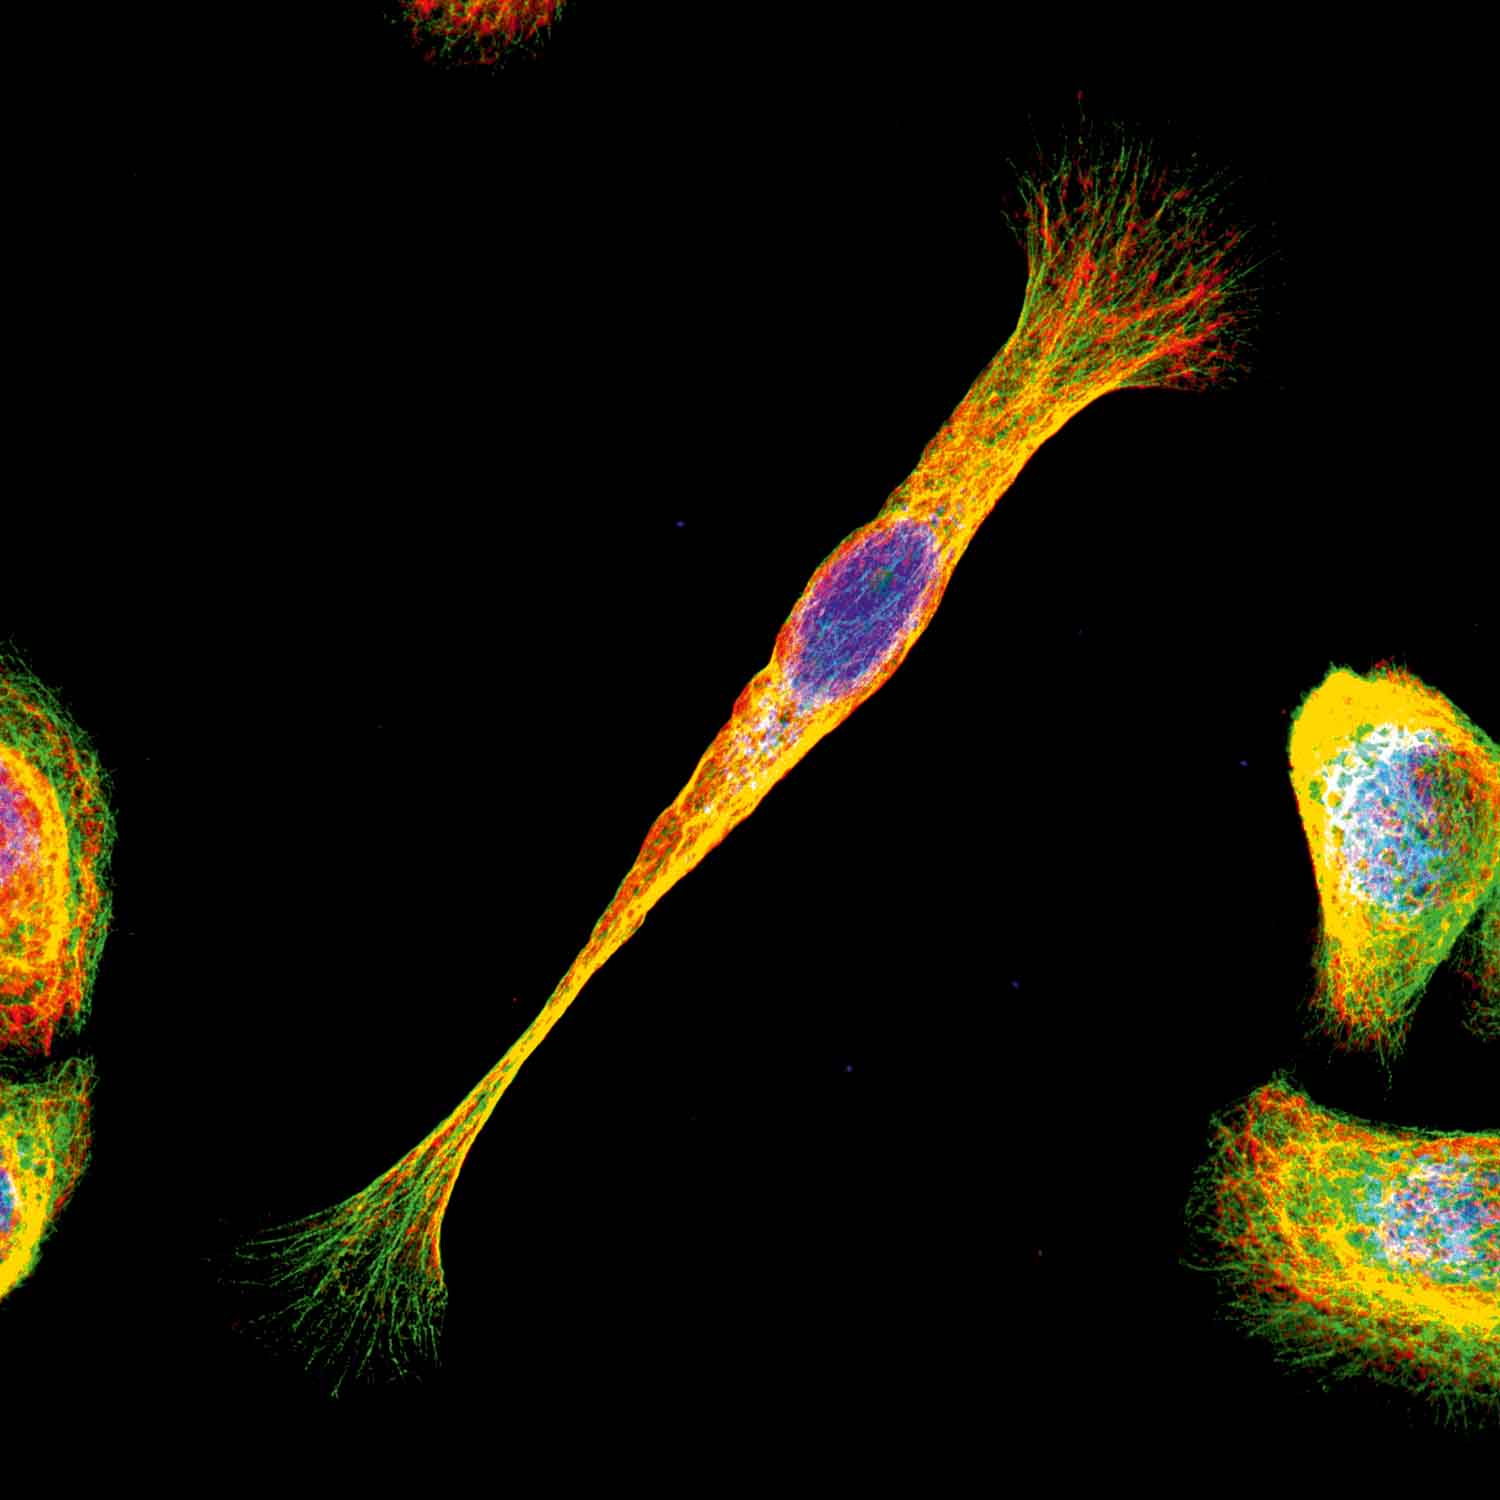

Cells on the Move (1st Place, Public Choice Award)
Yan Nie, Hereon
Cells are constantly on the move, which contributes to numerous physiological and pathological processes. For instance, cell migration is involved in immune response and the repair of injured tissues. In migrating cells, they display their polarity by reorganizing the distribution of plasma membrane, organelles, and cytoskeleton. Here we demonstrated the polarized organization of the cytoskeleton during migration, which is either enriched at the front or the rear of the cell. We conducted the confocal laser-scanning microscopy to visualize the major cytoskeleton components, microfilaments (Red), microtubules (Green), and intermediate filaments (Magenta). And the nucleus (Blue) was counterstained with Hoechst 33342. It will help us to understand the regulatory role of cytoskeletal polarity in regulating cell migration. Still, more detailed mechanistic insights are required to elucidate how cyto-polarity is established.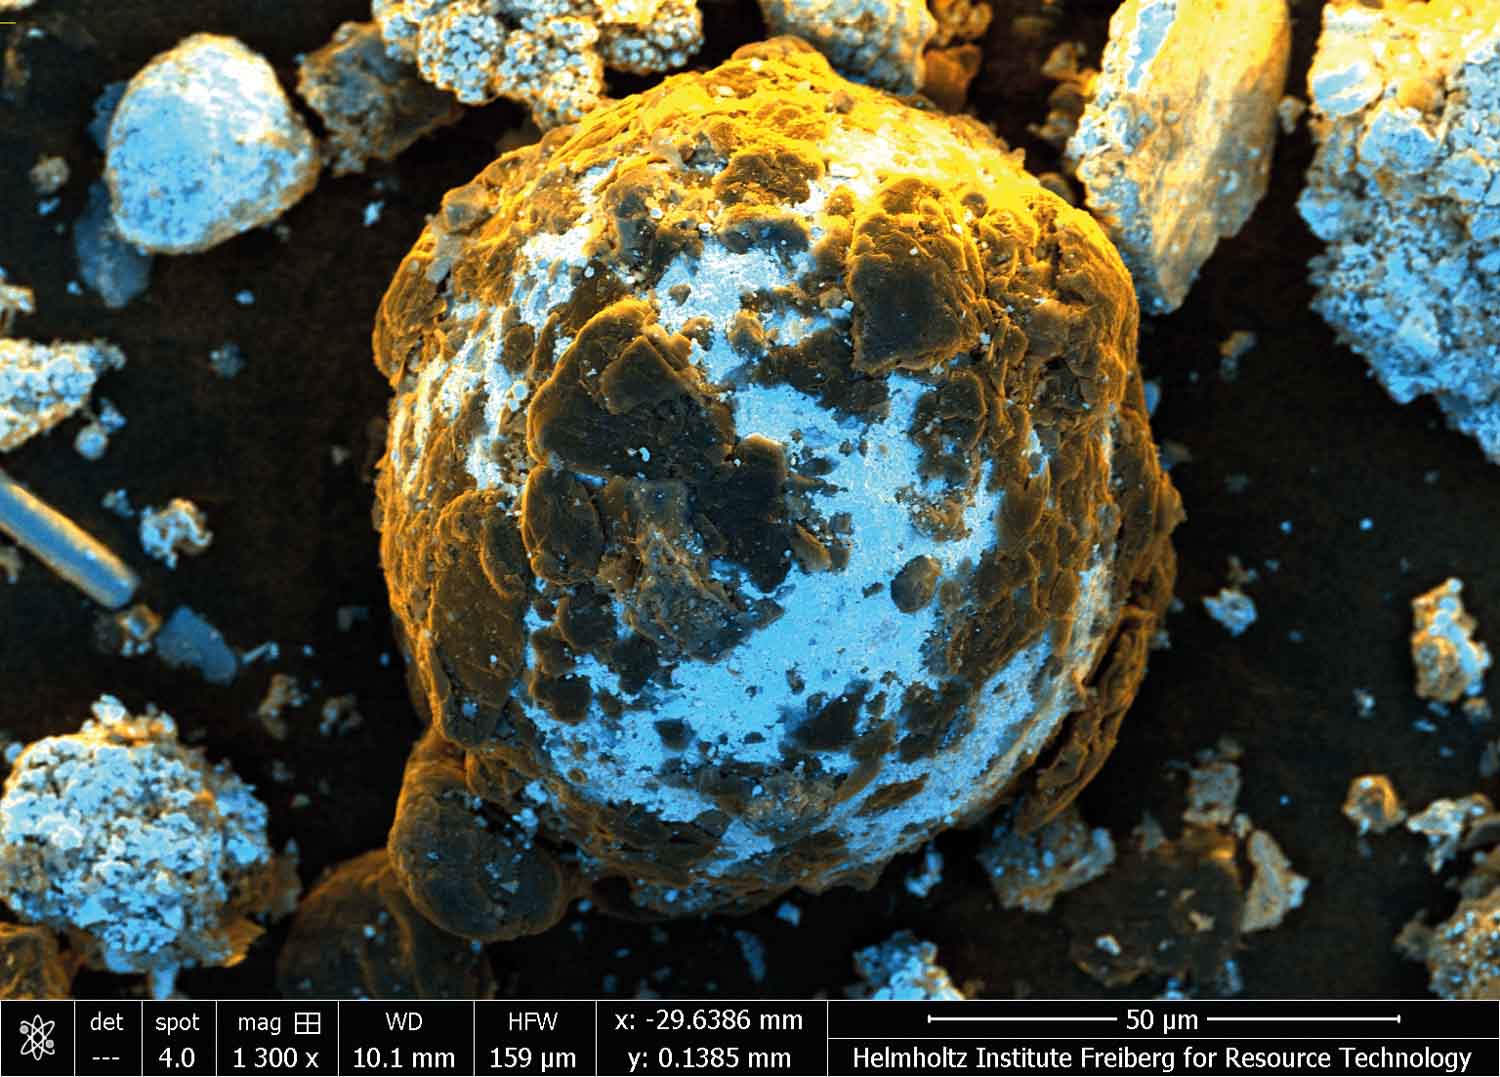

Lithium ion battery recycling (2nd Place, Public Choice Award)
Anna Vanderbruggen, HZDR
These particles come from the fine fraction of lithium ion battery recycling. I used a scanning electron microscope SEM images. In reality, everything looks black, but I used the superposition of the backscattered electron (BSE) image and secondary electron (SE) image with imposed colors to generate an image with compositional, textural, and topographic information. The BSE signal intensity is governed by the density (by means of the atomic number (Z)) of the particles and shows a contrast in elemental composition between each particle. The blue color was imposed for high density, highlighting the particles made of heavy metals, and black color for low density, highlighting the graphite and residual binder particles. The SE signal is sensitive toward the topography of the substrate surface and is highlighted through orange colors (like the sun on a mountain). This technique is really practical to see the impurities in a recycling product.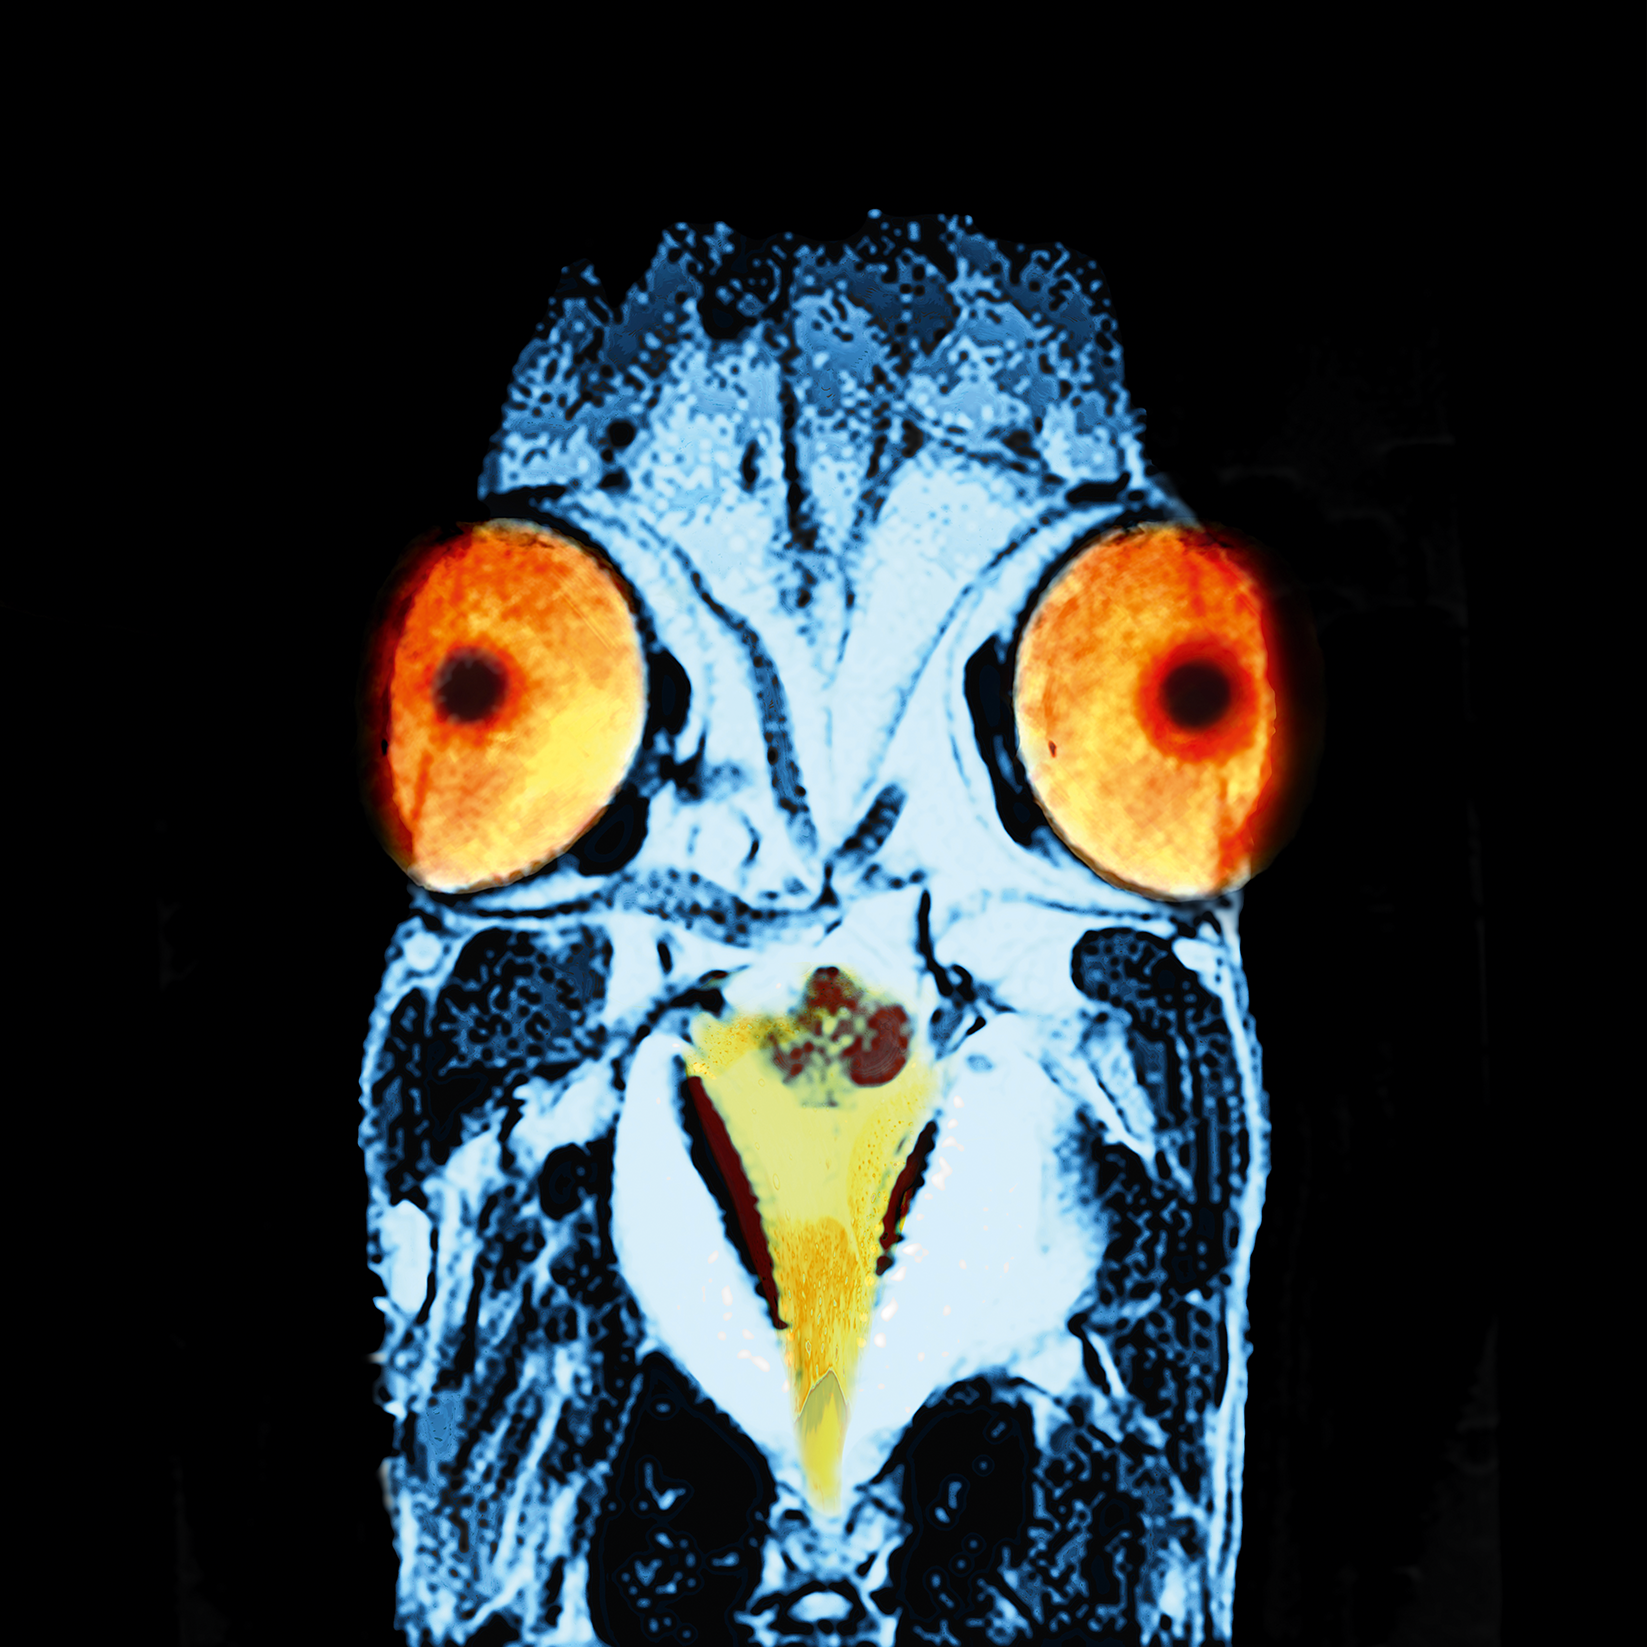

What’s inside a fish head? (3rd Place, Public Choice Award)
Christian Bock, AWI
This image is a coronal in vivo magnetic resonance image (MRI) of the head of a polar cod, Boreogadus saida (acquired on a 9.4T pre-clinical MRI scanner, MRI sequence RARE, Bruker Biospin). To enhance details and adjust colors we used Adobe Photoshop (segmentation, image overlay and DxO Nik Color Efex). The image is part of an in vivo multi-parameter MRI experiment on the effects of ocean acidification on polar cod neurophysiology. Ocean acidification was simulated in the MRI scanner to conduct studies on energy metabolism and acid-base regulation in non-immobilized and unanesthetized polar cod. The goal of the study was to investigate the underlying mechanisms for the observed changes in fish behavior under ocean acidification. We indeed found perturbations in acid-base regulation in the polar cod brain.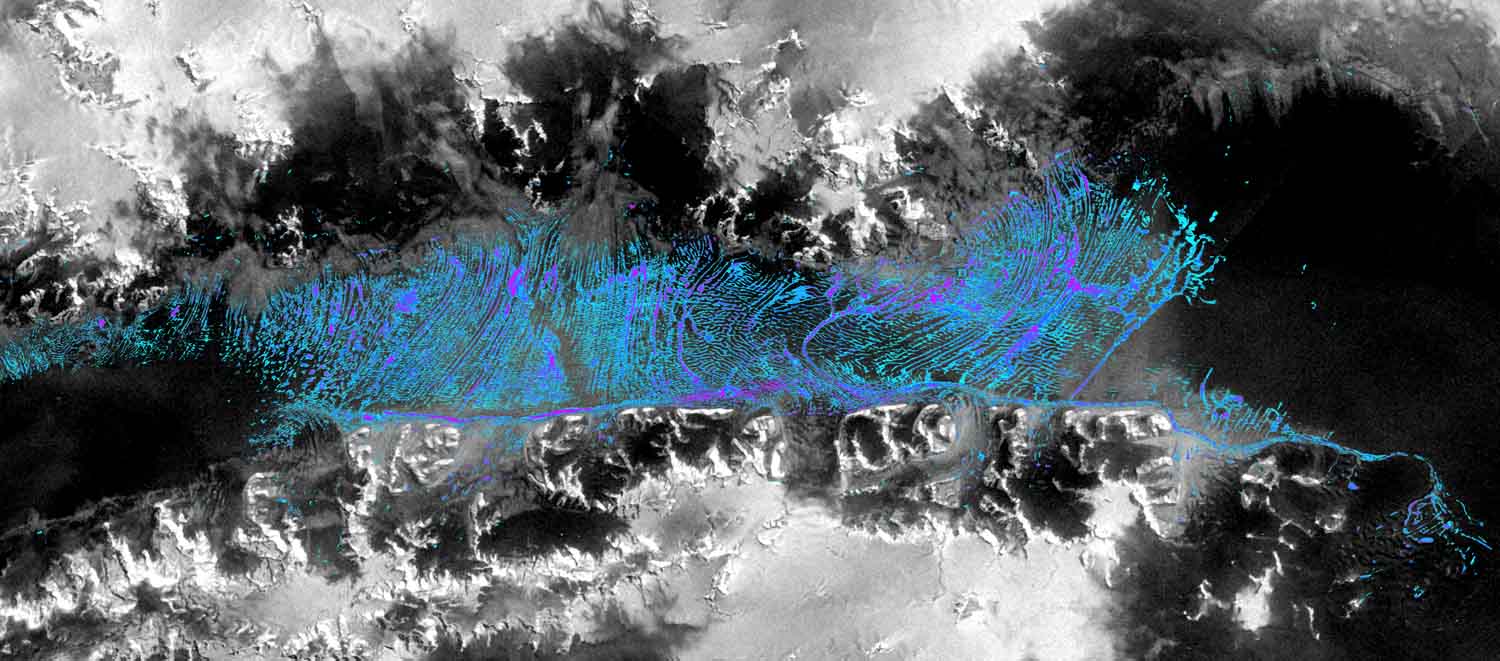

Global warming accelerates Antarctic melting
Mariel Dirscherl, DLR
“Global warming accelerates Antarctic melting” shows the bi-weekly recurrence times of supraglacial lakes on George VI Ice Shelf, Antarctic Peninsula, during the summer melting seasons 2015-2021. The bi-weekly recurrence times of supraglacial lakes were calculated through aggregation of bi-weekly image classifications derived from data of the Sentinel-1 radar and optical Sentinel-2 satellite missions whereat bright blue color represents regions of low lake recurrence and purple color shows regions of high lake recurrence. The greyscale image in the background is a Sentinel-1 radar backscatter product. Image classification of optical and radar data was performed through application of artificial intelligence including state-of-the-art machine learning and deep learning. The delineation of supraglacial lakes on George VI Ice Shelf was performed as part of an Antarctic-wide mapping strategy.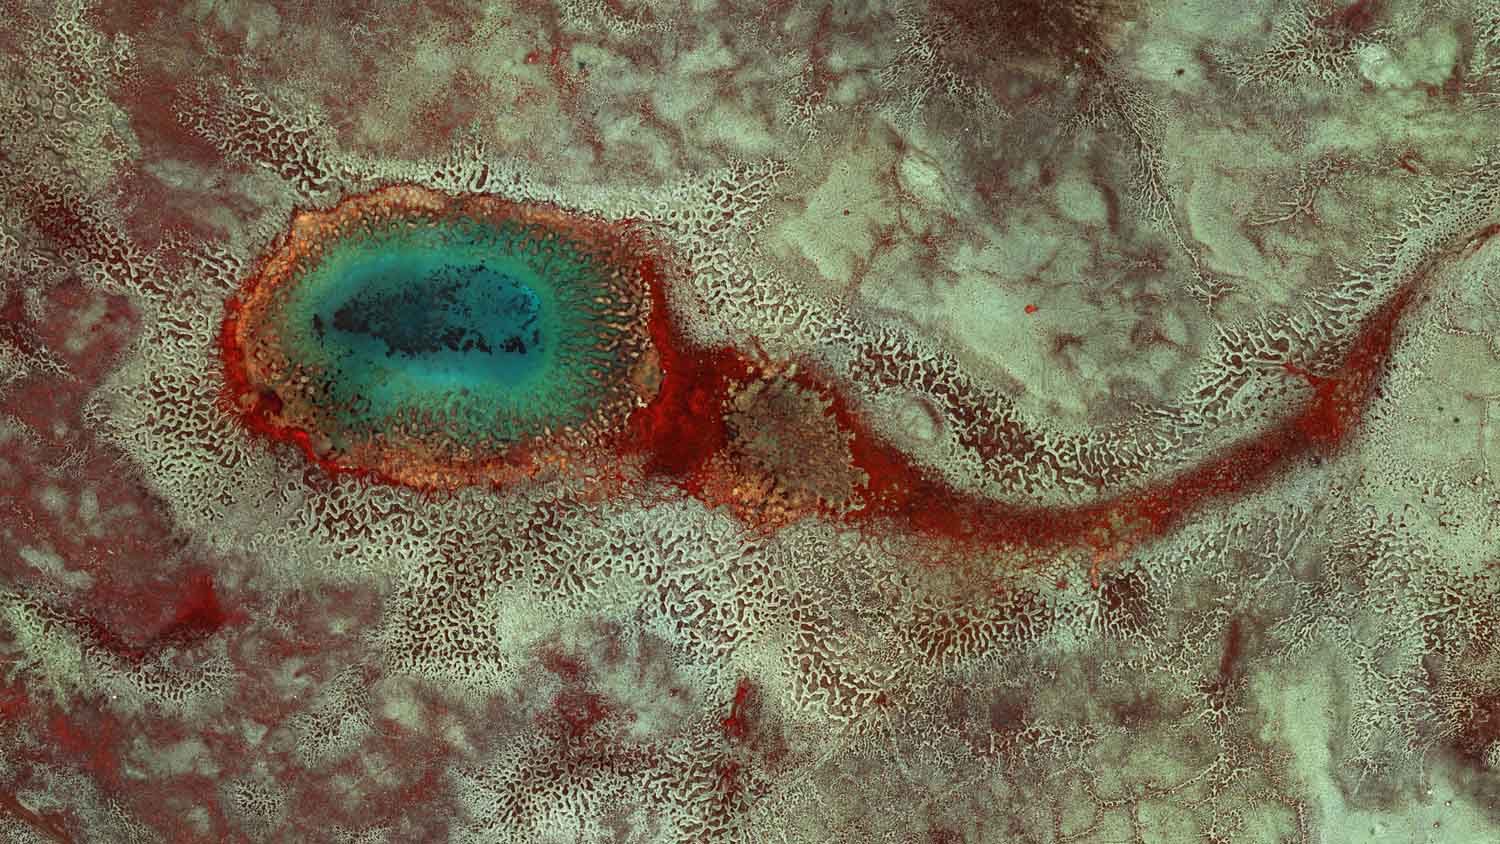

Permafrost lake on patterned ground
Ernst Hauber, DLR
The aerial image was acquired in summer 2020 with the MACS (Modular Aerial Camera System), flown at an altitude of 820 m onboard the Polar 5 aircraft of the Alfred-Wegener-Institute (AWI). The MACS system was developed by the Institute of Optical Sensor Systems of the German Aerospace Center (DLR). The flight campaign over selected parts of the Arctic Archipelago of Svalbard was initiated by the proposal SPLAM-aero20, submitted by an international research group consisting of the Westfälische Wilhelms-Universität Münster, the DLR Institute of Planetary Research in Berlin, and the University of Gothenburg (Sweden). The goal of the flight campaign was the acquisition of stereo and color images that show permafrost landscapes on Spitsbergen (the largest island of Svalbard) as terrestrial analogues for morphologically similar landforms on Mars. Mars is by definition a permafrost planet, and the analysis of such surface features is essential for reconstructing its climate history.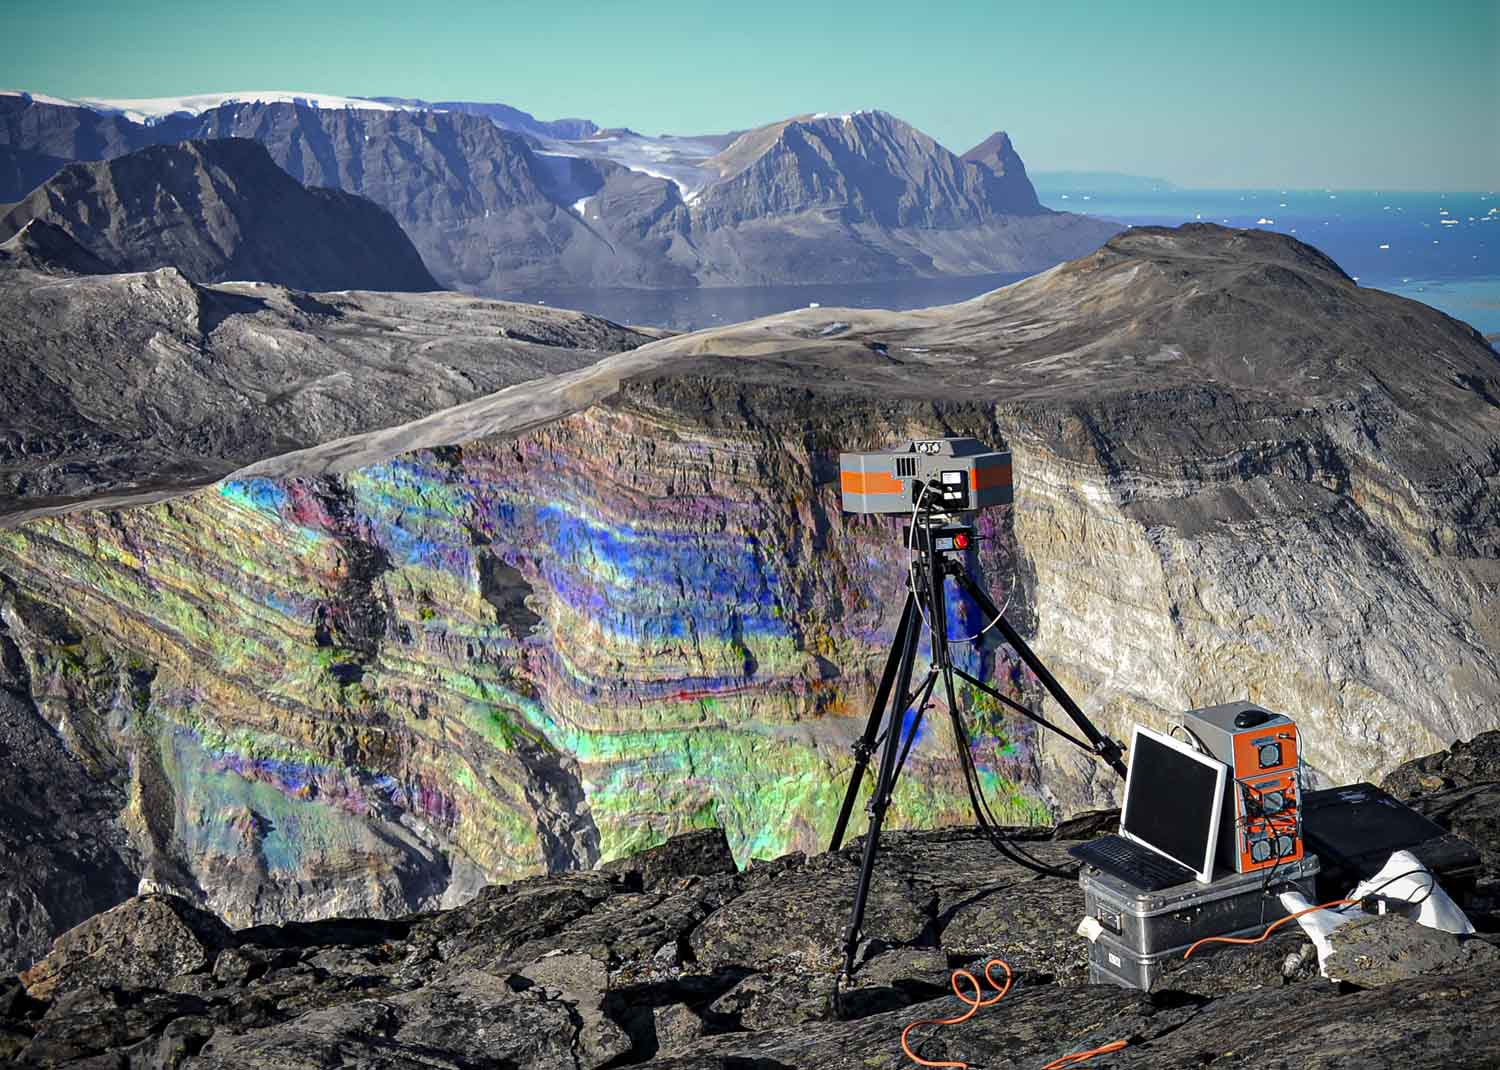

Spectral detective
Sam Thiele, HZDR
A billion-year history of tropical seas and ancient mountains is made visible by hyperspectral imaging in West Greenland. Ancient life precipitated calcium carbonate (blue) from tropical seawater to form a limestone reef that, during a still mysterious process, was partially converted to dolomite (green) before being buried, folded and metamorphosed to make this cliff of marble (green/blue) and amphibolite (red). The distribution of minerals revealed by the false-color hyperspectral image helps disentangle this complex geology to piece together the history of our planet.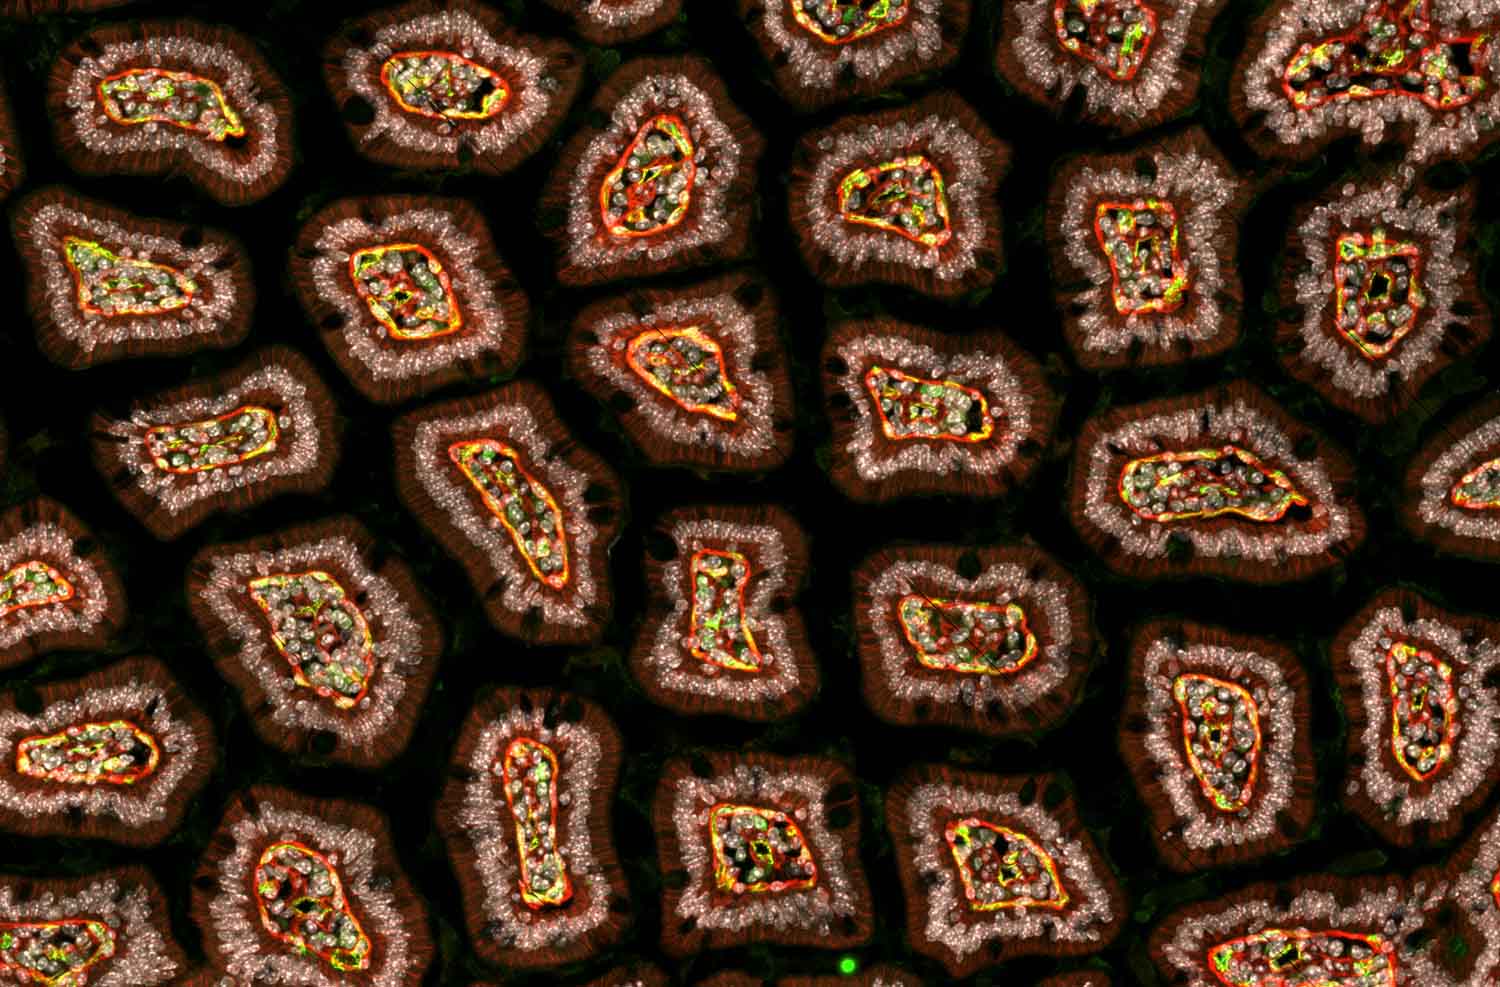

The solatium bouquet
Robert Luck, DKFZ
The endothelium branches out like a tree in each corner of the body and is therefore omnipresent. It has a unique and critical role in the cellular communication, as it connects the circulation and all its molecules and signals, with the cells of the different organs. Even though the function might be similar, the endothelial cells developed a highly diversified cell population not just between but also within an organ. Our aim is to study this diversity on protein level, whereby we are specifically interested in the proteins and receptors located on the cell surface. The confocal picture shows the first trial to label the vascular surface ( green) with biotin (red). The picture shows a section through the villi of the gut (cells – grey).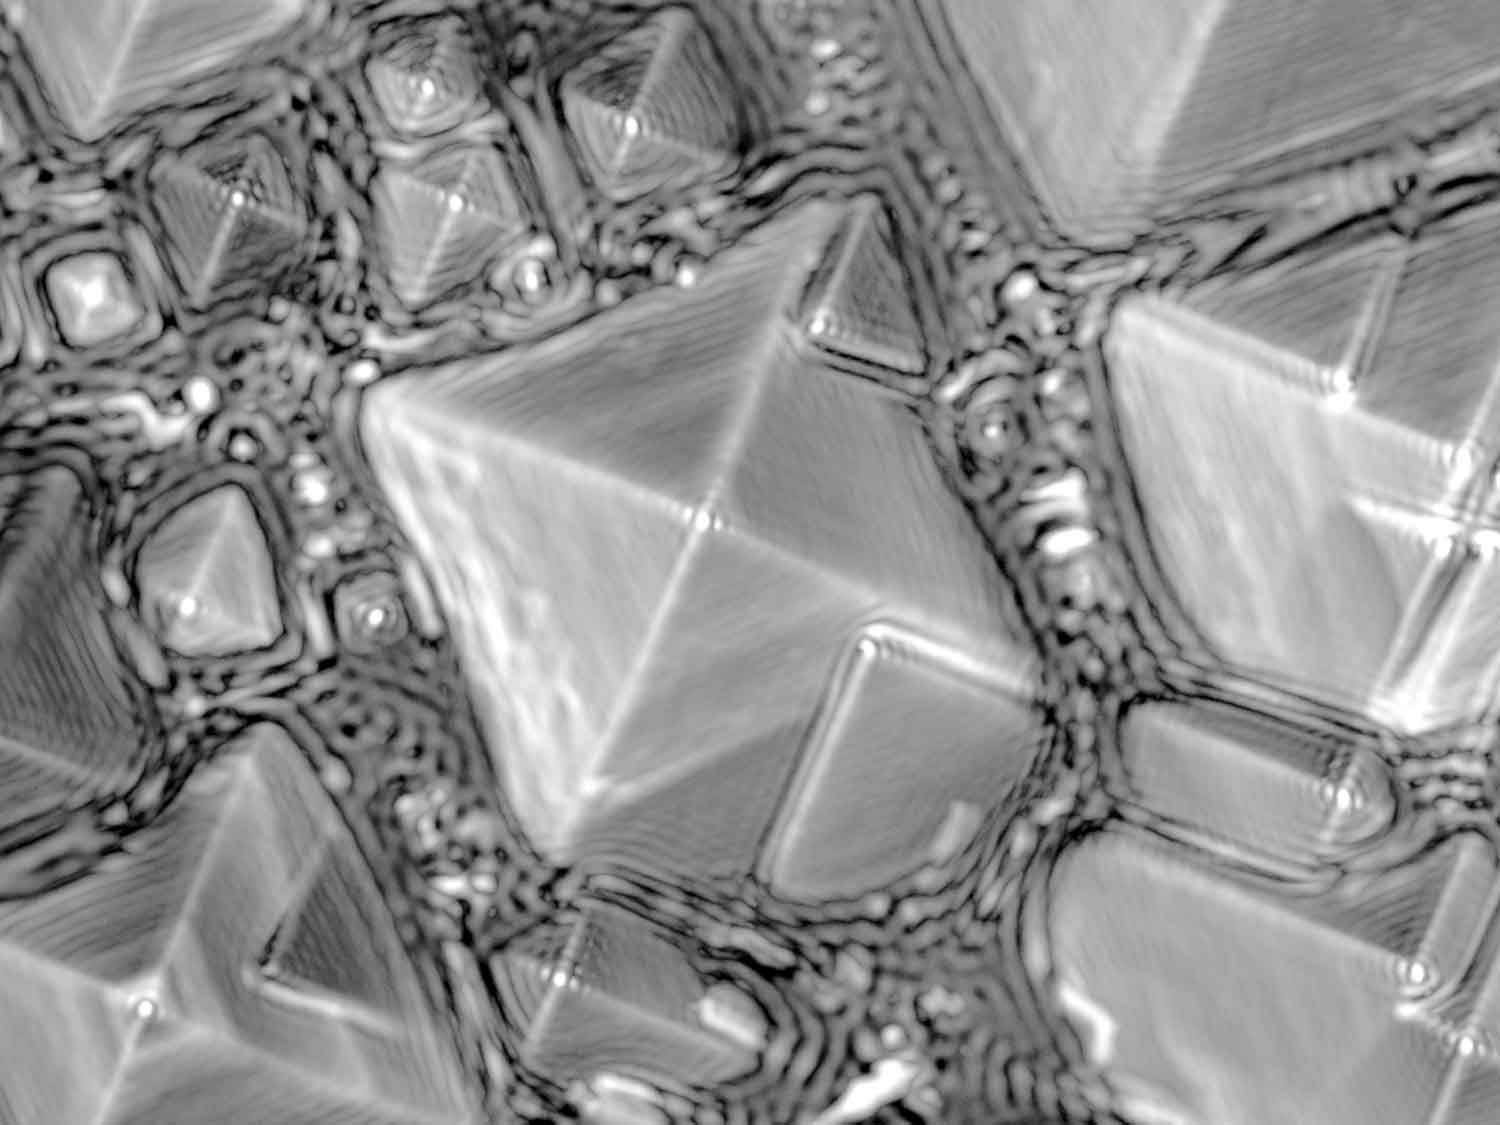

Pyramids at the zebra crossing
Sarah Scheffler, Hereon
The image was captured on a confocal laser scanning microscope (CLSM). The image shows pyramidal structure produced by wet – chemical etching of the surface of a silicon wafer. These structures are applied as anti – reflective components in light absorbing devices such as certain types of solar cells. In this case, CLSM is used to study the etching process. Interesting patterns of dark and white lines are observed over the image, reminiscent of zebra crossing stripes. These patterns, however, are an instrumental artifact, and must be removed by adequate selection of image acquisition and post processing parameters. Confocal laser microscopy is a fast, nondestructive method of obtaining quantitative topographical images with few – nanometer resolution. In this case, CLSM is being used as a quick quality control method in the development of a chemical etching process. The pyramid at the center of the image has a base of around 7 μm.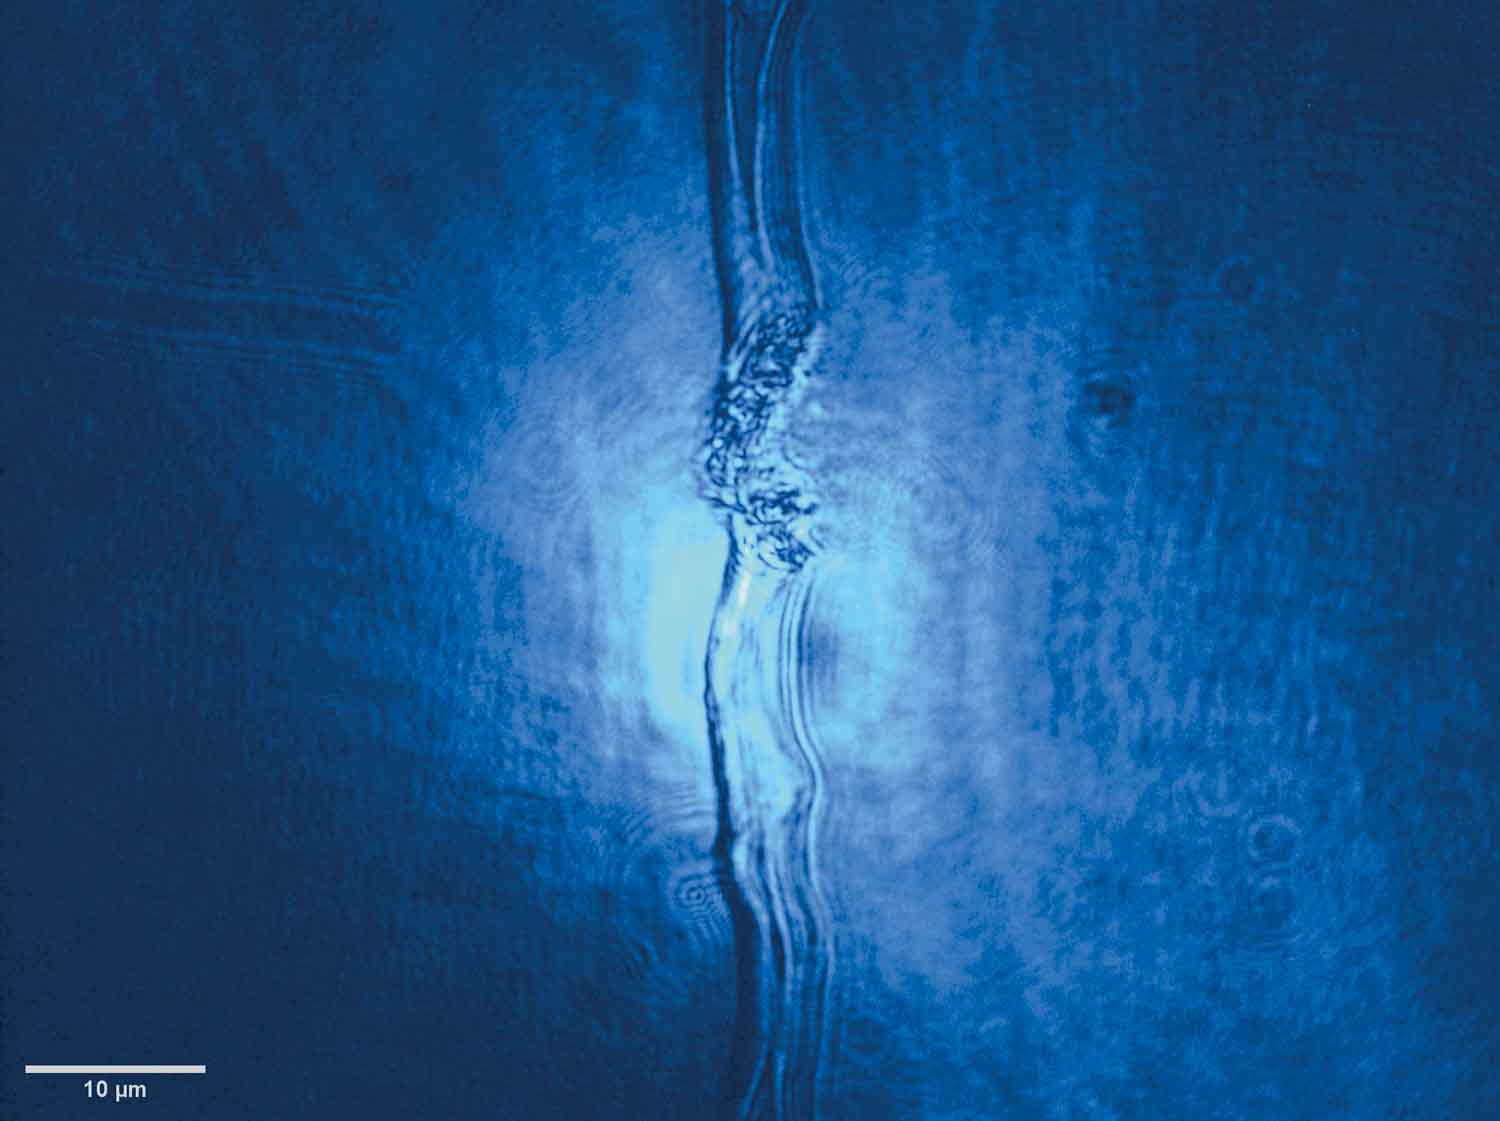

A bite of hydrogen ice
Stefan Assenbaum, HZDR
The image shows a continuous jet of cryogenic solid hydrogen that is used as a target for laser-driven proton acceleration at the Draco Laser facility at Helmholtz-Zentrum Dresden-Rossendorf (HZDR). A part of the cylindrical target with a diameter of 4.4 μm is evaporated after irradiation by a 14 ps long laser pulse with a peak intensity of 2.3e12 W/ cm². This laser pulse is incident from the left and is too weak to damage the target front directly. However, due to focusing within the dielectric hydrogen cylinder, the local intensity at the target rear side surpasses the dielectric breakdown threshold, causing local ionization and evaporation of material. Studying this laser-target interaction around the damage threshold intensity is crucial for high power laser physics, as it defines the start of plasma formation during the rising flank of a high power laser.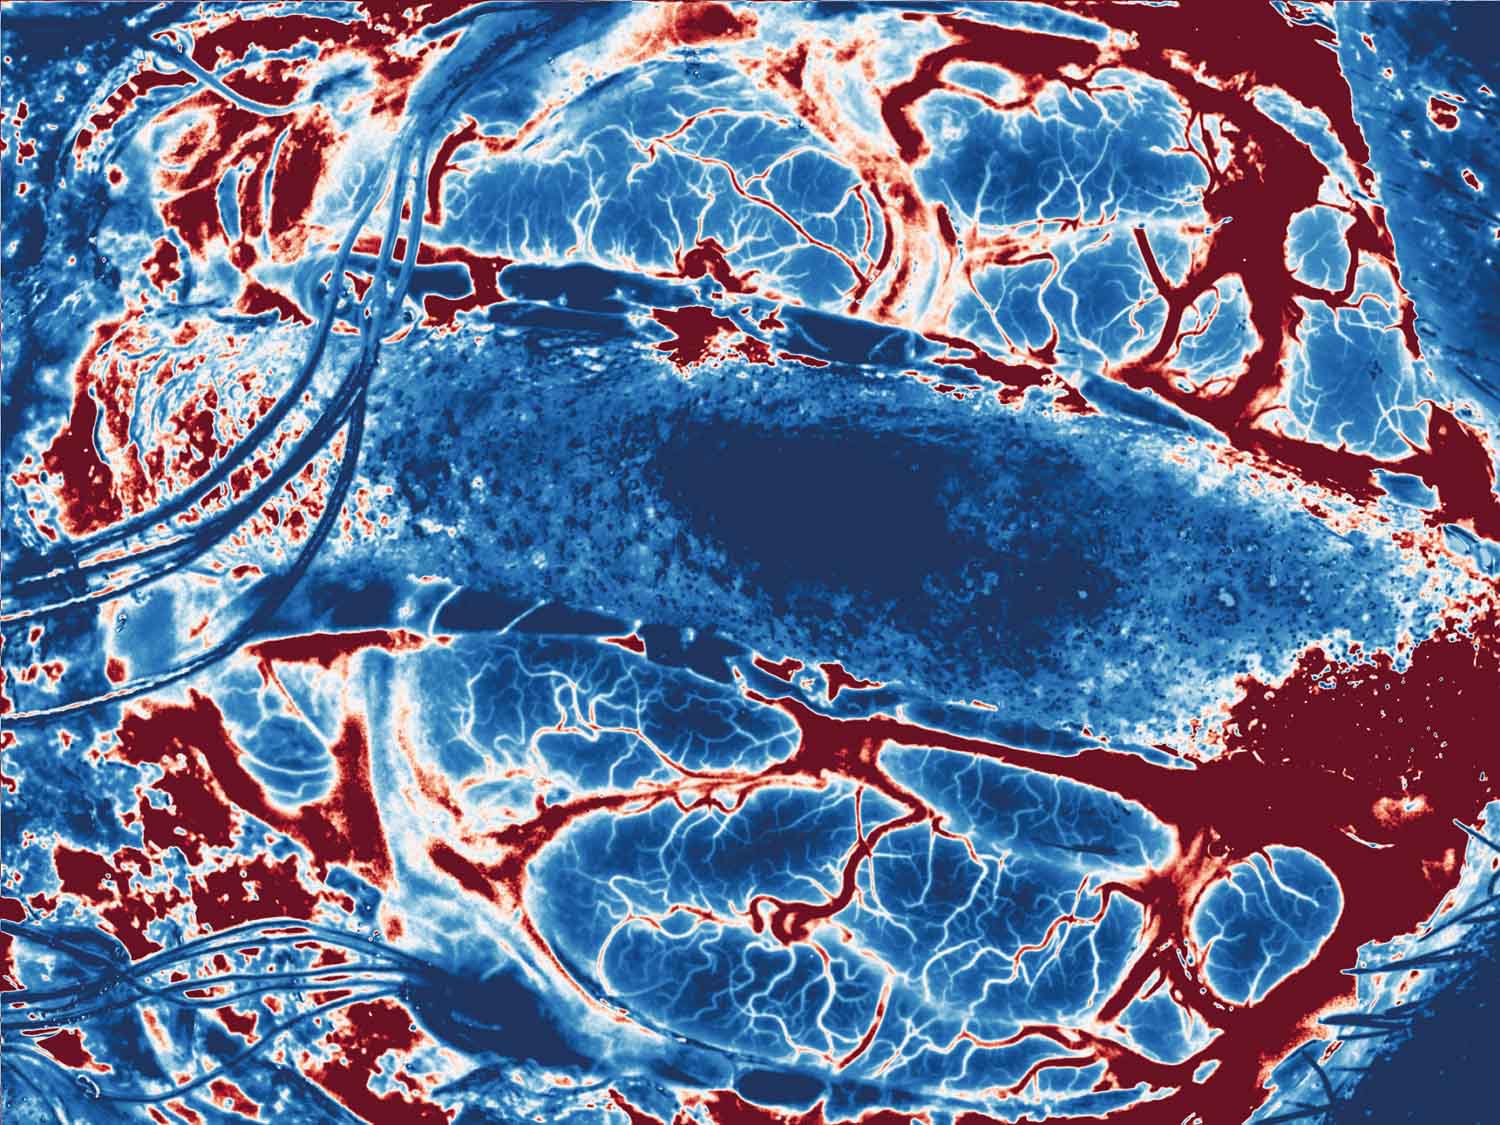

Deep Brain #1
Leonardo Ayala, DKFZ
This image of the brain cortex was recorded with a multispectral camera and processed with a deep learning algorithm. The colors represent the level of blood oxygenation in the tissue, blue means low, white means intermediate and red means high oxygenation. This image presents a high resolution oxygenation map of the entire brain cortex. The analysis of images like these helps to develop drug treatments for a phenomenon called spreading depolarizations, which play a central role in many diseases associated with the central nervous system.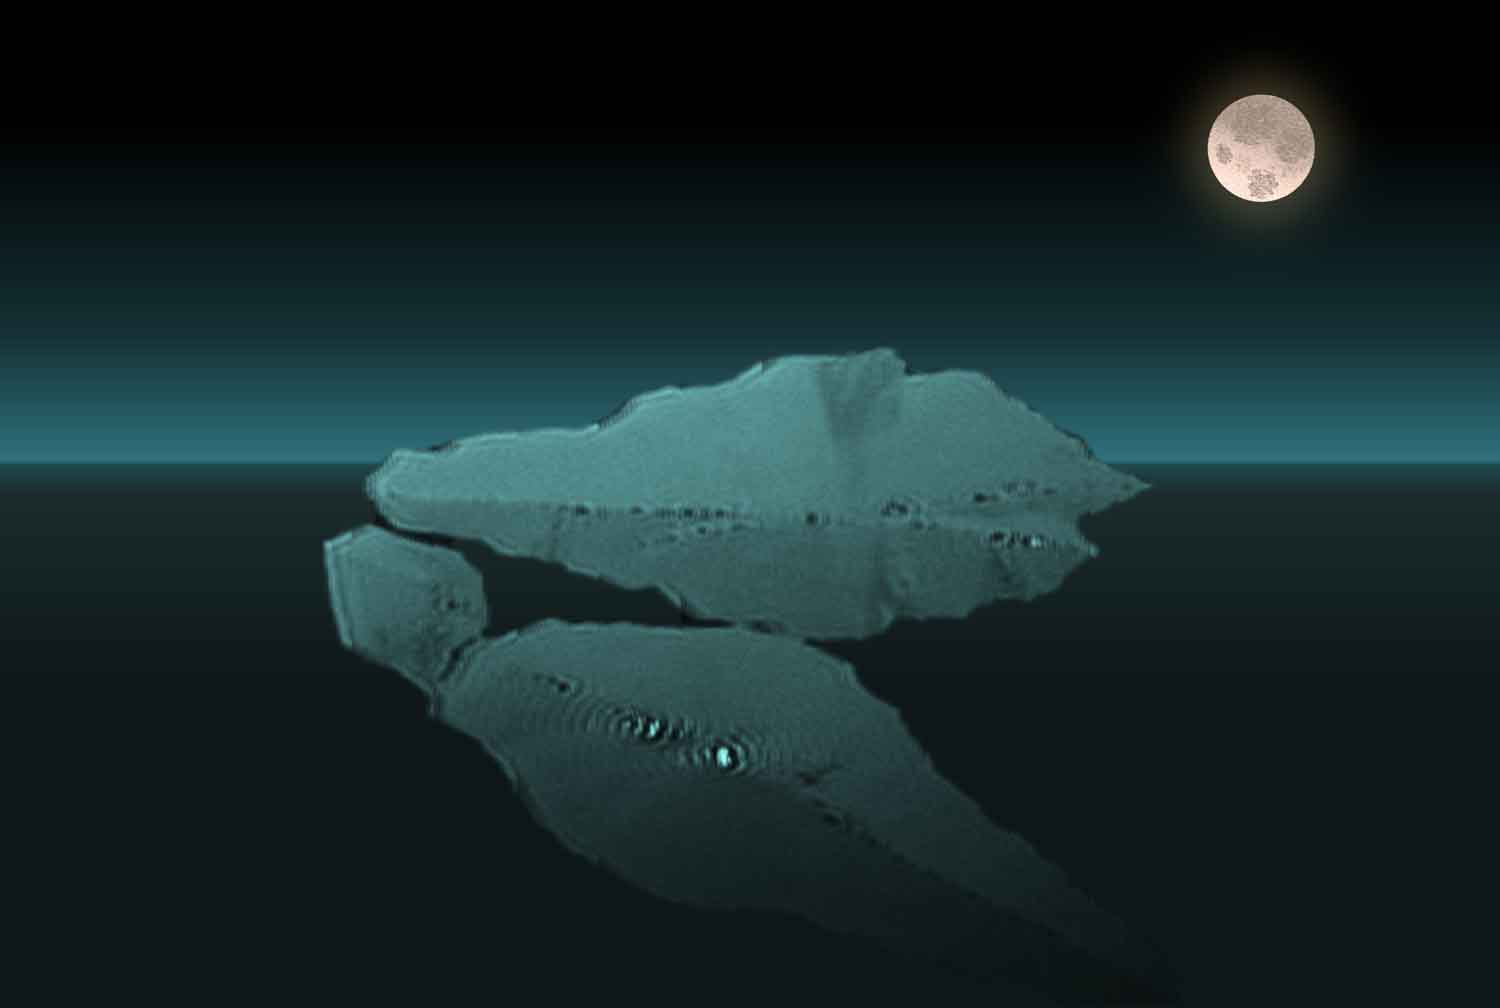

S.O.S. Iceberg
Shivam Saretia, Hereon
Iceberg (polymer single crystal) floating on the water surface. To visualize such floating structures, we have applied Brewster angle microscopy, which measures the changes in the refractive index at the air-water interface. Polymer single crystals are emerging in the medical field for vaccine delivery, filtration membranes, nanomotors, and preparing functionalized coatings. These unique single crystals (~5 nm thick; >100 μm lateral size) are from medically applied oligo (ε-caprolactone) diol and are prepared using the sustainable, health, and safety-friendly Langmuir technique. Unlike other crystallization methods that need the use of organic solvents and solid substrate, the Langmuir technique applies an air-water interface at room temperature for the large-scale production of single crystals. For a visual impact, the single crystals are colored blue and an image of the moon and horizon is added.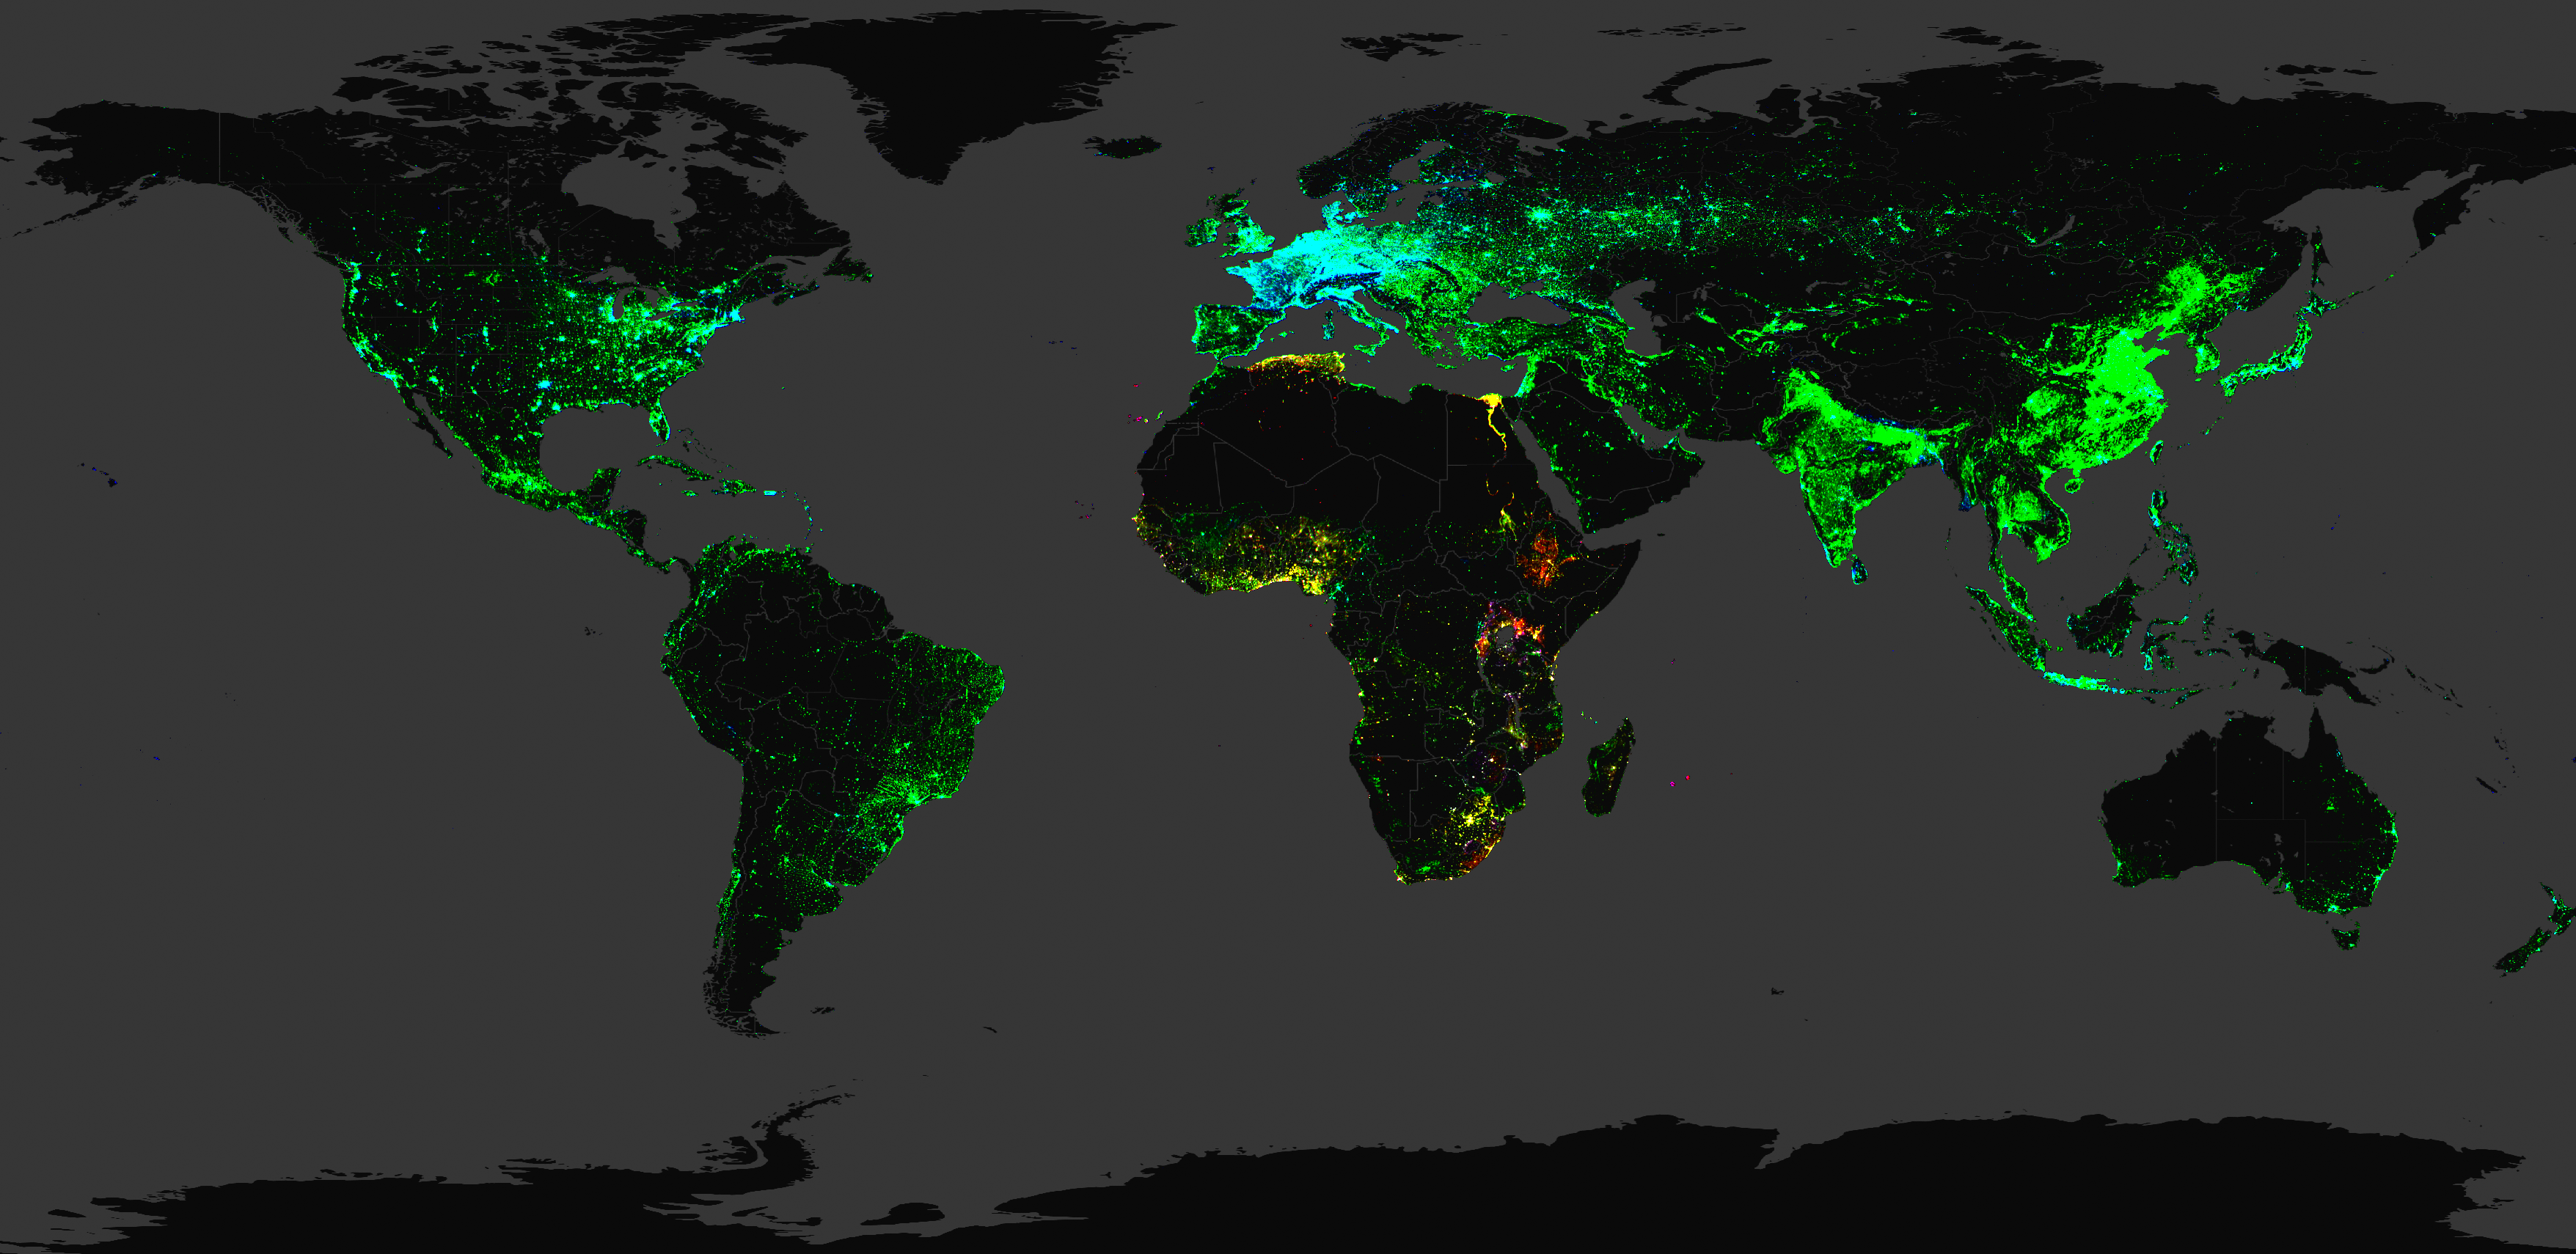

Unveil Mystery of Global Buildings
Yuanyuan Wang, DLR
Identifying all the buildings on the planet would further a better understanding of human activities across the globe, which is crucial for making key strategic decisions needed to tackle the grand societal challenges of the century, such as urbanization and climate change. By using a big data analytics approach and nearly 800,000 high resolution PlanetScope satellite images, we generated the first-ever footprint of every individual building across the globe – The Global OpenBuildingMap (OBM). The submitted image was created from the results of this 800,000 satellite images plus other openly available building footprint data sources from OpenStreetMap (OSM) and Google. It shows the global building density from three sources: our Global OBM (green), Google (red), and OSM (blue). Pure RGB color indicates only one source is available. Blended colors, including cyan, yellow, magenta, and white, indicate multiple sources are available. It is surprising to see the large void in the open knowledge of our buildings.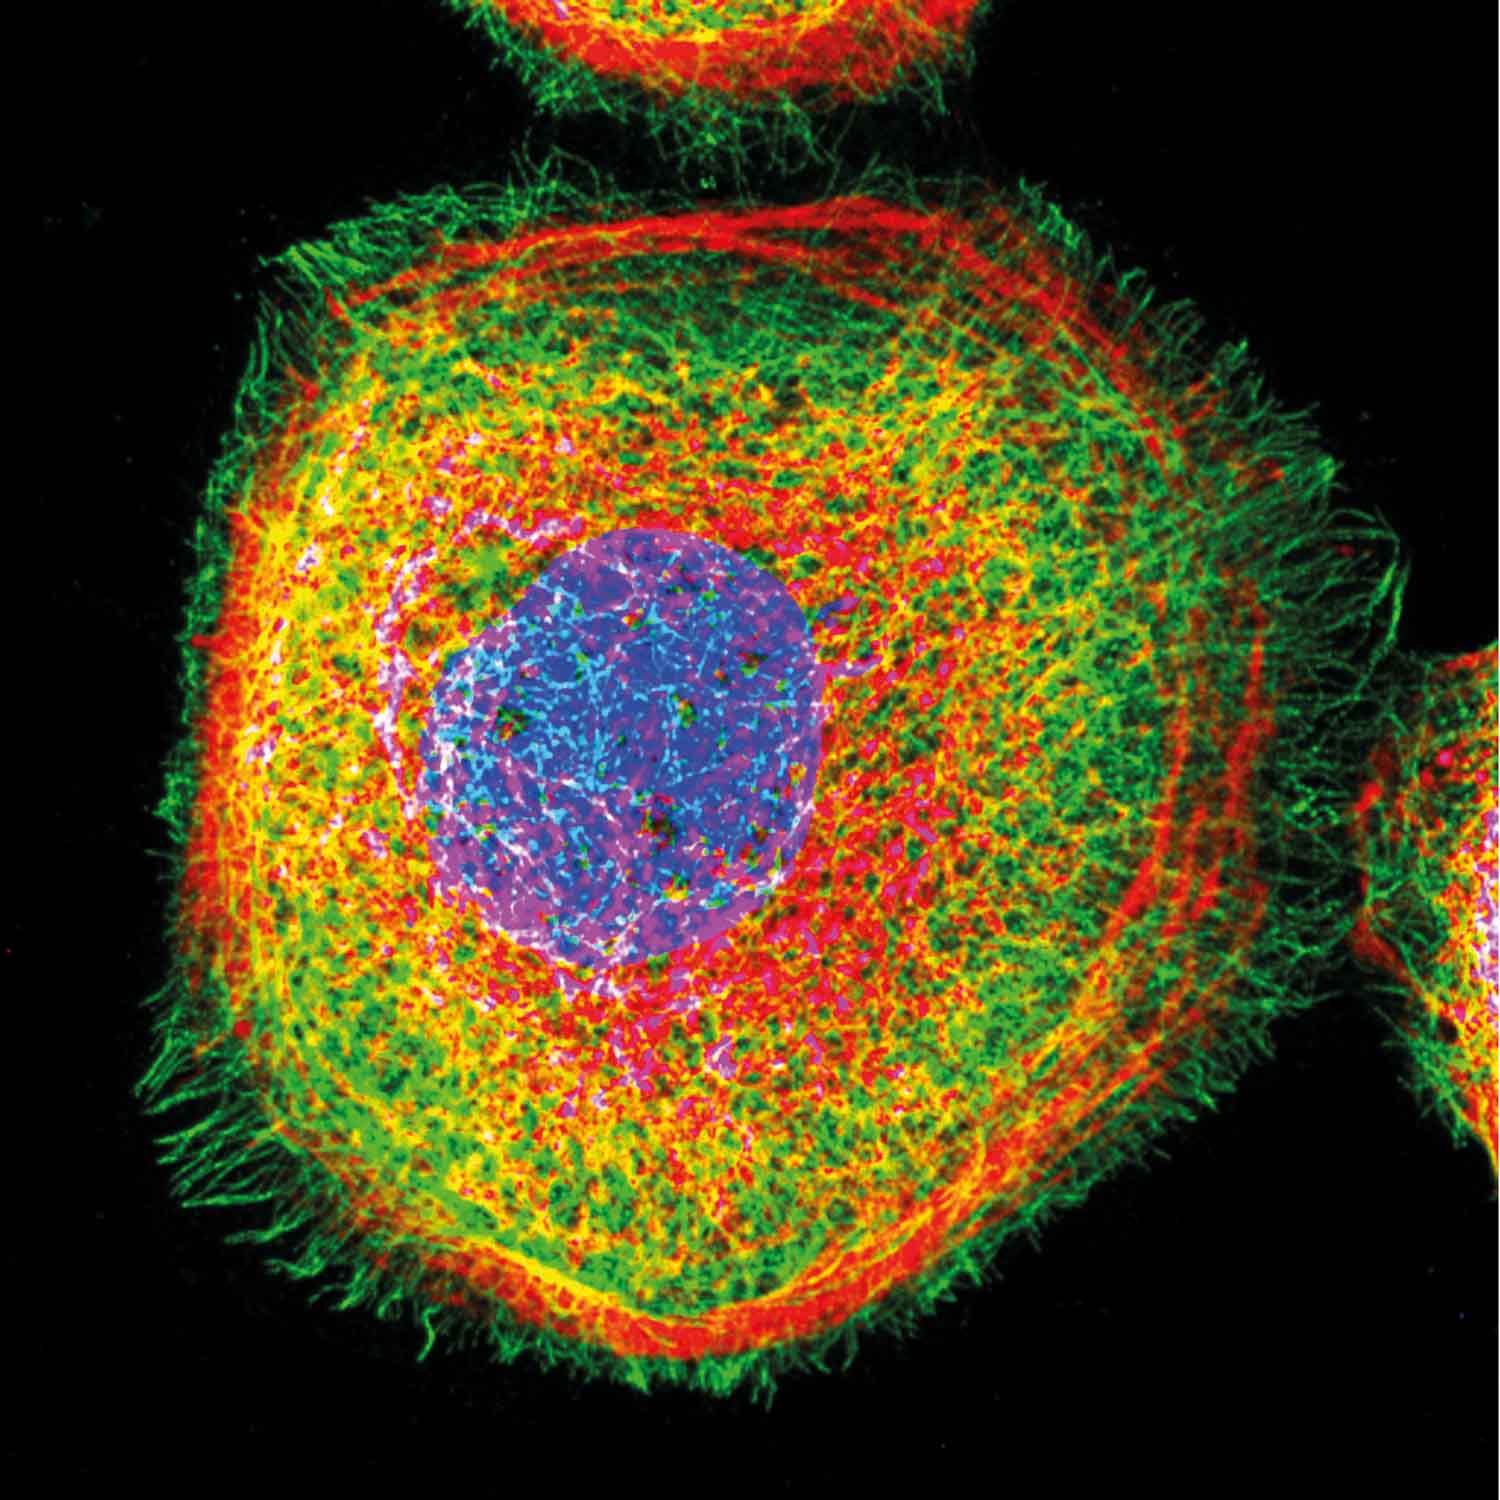

Rich inner life of cells
Yan Nie, Hereon
The cell is the smallest unit of living organisms. Its constituents are numerous, dynamic, and diverse, which gives rise to a heterogeneous yet highly organized system. The cytoskeleton is made of filamentous protein networks, including microfilaments (Red), microtubules (Green), and intermediate filaments (Magenta), providing structural support to the cell in both cytoplasm and nucleus. While the major component of the nucleus, the largest organelle in the cell, is the chromatin fiber that is composed of deoxyribonucleic acid (DNA, Blue). It is still exciting but challenging to investigate the signaling and communication between cytoplasmic and nuclear pools. Here, we studied the influence of cytoskeletal proteins dynamics in regulating the chromosome organization, using a confocal laser-scanning microscope.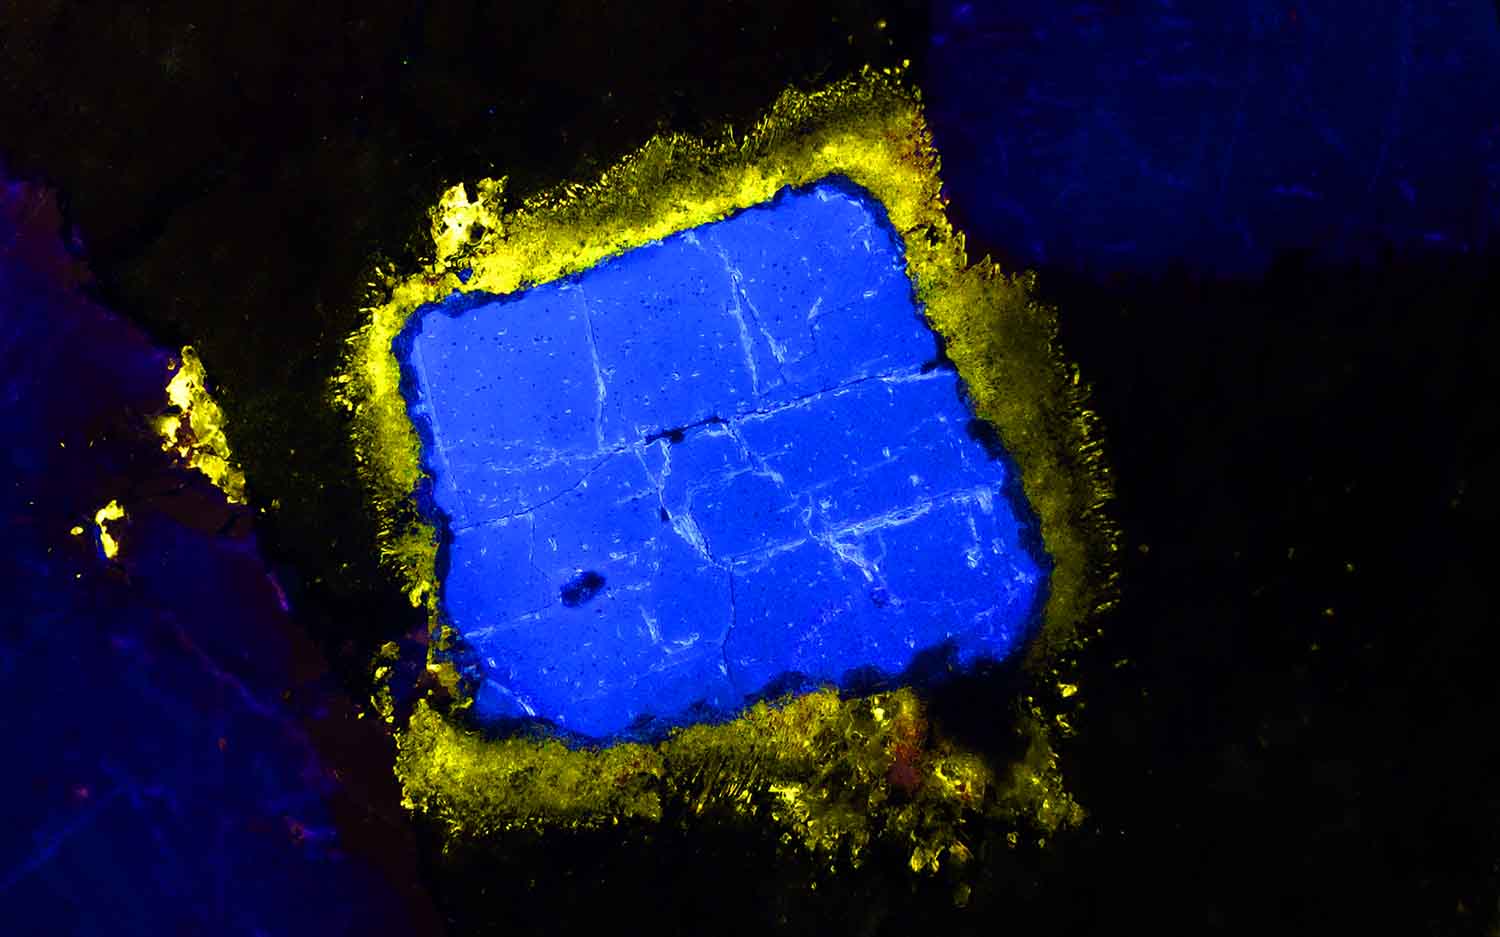

Nepheline Crystal with Pectolite
Robert Möckel, HZDR
The micrograph was taken using a Cathodoluminescence (CL) microscope were an electron beam induces fluorescence radiation, partly in the visible range. The picture shows an almost quadratic appearing nepheline crystal (blue), surrounded by pectolite (yellow). The sample derives from the Ilimaussaq intrusive complex, Greenland, a part of which is famous for its rare earth element (REE) deposit. The shown minerals do not contain larger amounts or REE, though. The picture was taken using an Olympus microscope and a lumic HC7-LM cathodoluminescence stage, image width approx. 3 mm. Due to the colors we could also name it the Ukrainian Silicate.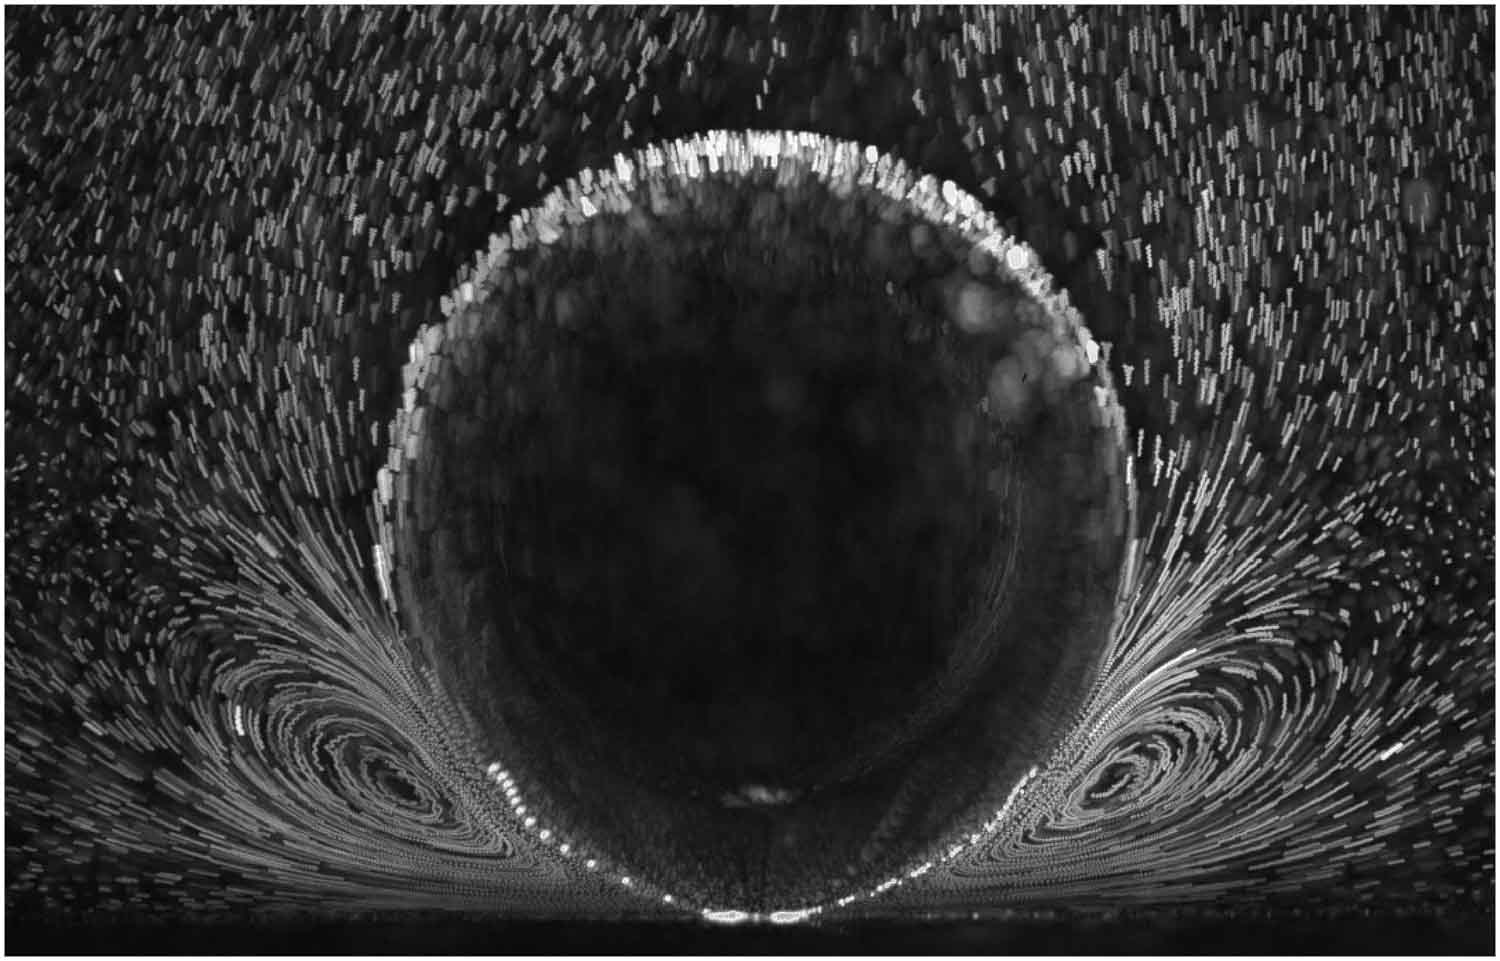

Hydrogen bubble against Marangoni convection
Aleksandr Bashkatov, HZDR
On the image, visualization of thermocapillary driven convection also known as Marangoni convection around the hydrogen gas bubble is presented during water electrolysis. The recording was performed using a Particles Tracking Velocimetry system consisting of a high-speed camera connected to the microscope and a high-intensity laser. The visualization was carried out at 1000 frames/s, using a 5-micrometer polystyrene fluorescent particles seeded into the flow and illuminated by the laser. The light emitted by the fluorescent particles, representing their trajectories over time, was first recorded by the camera and finally averaged over a 50 ms time interval. For a successful transition towards a net-zero-emissions industry, it is crucial to replace fossil fuels such as natural gas by renewable energy sources. One promising technology is water electrolysis using solar- or wind-derived electricity to produce high-purity hydrogen gas.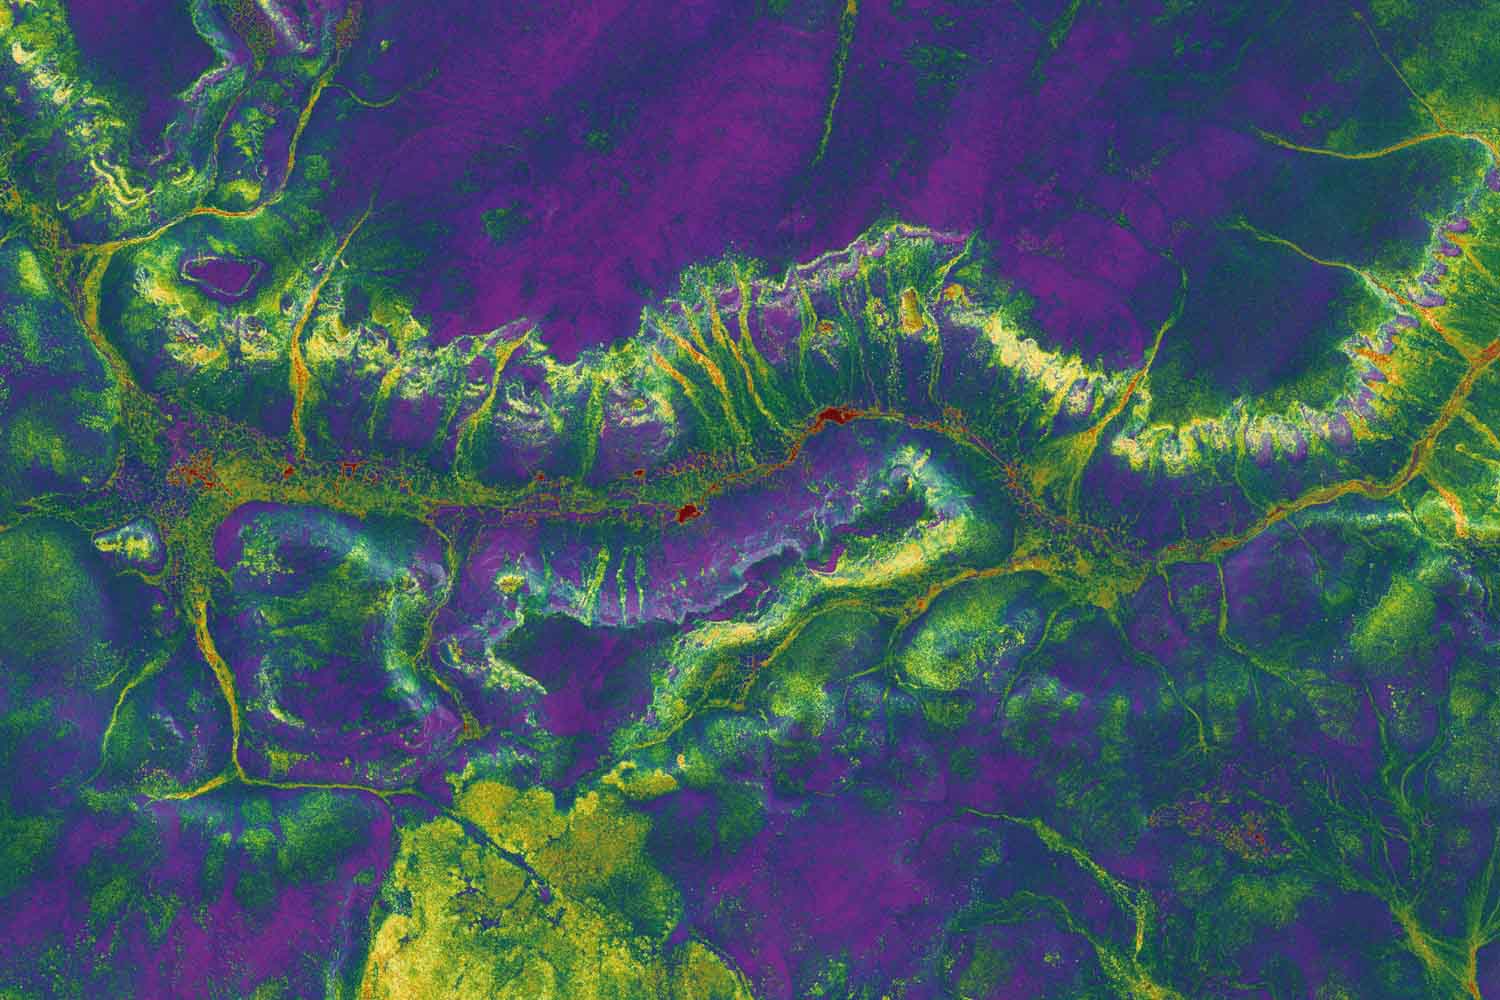

Tundra dragon
Inge Grünberg, AWI
Imagine a dragon hidden in the far north, just about to wake up after a long sleep. This image reveals the dragon valley hidden in the tundra landscape at Trail Valley Creek in Northwest Territories, Canada. The false color image of 3.9 km width and 1 m spatial resolution shows surface roughness combined with laser return amplitude obtained from 150 km² of airborne laser scanning data. We operated the laser scanner on board of the AWI Polar 5 research aero plane in August 2018. To reveal the dragon, we processed the raw laser scanning data and obtained the digital elevation model and an image of the amplitude of the return signal recorded by the full-waveform instrument. We combined the surface roughness calculated from the elevation model and the amplitude to a single image. Using this false color representation, surface features such as erosion and soil creeping appear clearly, while we can tell apart different vegetation types at the same time.